


Received 30 October 2018; Revised 6 February 2019; Accepted 15 February 2019
This is an open access article under the CC BY license (https://creativecommons.org/licenses/by/4.0/legalcode).
Pedro Varela-Vázquez, Ph.D., Lecturer at the Department of Business Management and ICEDE Research Group. Faculty of Economics and Business. Universidade de Santiago de Compostela, Avenida do Burgo s/n, 15782 Santiago de Compostela, Galicia, Spain, e-mail: This email address is being protected from spambots. You need JavaScript enabled to view it., corresponding author  .
.
Manuel González-López, Ph.D., Associate Professor at the Department of Applied Economics and ICEDE Research Group. Faculty of Economics and Business. Universidade de Santiago de Compostela, Avenida do Burgo s/n, 15782 Santiago de Compostela, Galicia, Spain, e-mail: This email address is being protected from spambots. You need JavaScript enabled to view it. .
María del Carmen Sánchez-Carreira, Ph.D., Assistant Professor at the Department of Applied Economics and ICEDE Research Group. Faculty of Economics and Business. Universidade de Santiago de Compostela. Avenida do Burgo s/n, 15782 Santiago de Compostela, Galicia, Spain, e-mail: This email address is being protected from spambots. You need JavaScript enabled to view it. .
Abstract
The Framework Programmes (FPs) represent one key supply-side instrument in the innovation policy mix implemented directly by the European Union (EU). Since its final goal is fostering innovation and competitiveness, it is advisable to analyze the spatial distribution of this instrument across EU regions. The main aim of this paper is to analyze the regional allocation of the coordination and participation in projects under the 6th and the 7th FPs, as well as the distribution of funds from Horizon 2020 (the 8th FP). For this purpose, a comprehensive database regionalized at NUTS 2 level was elaborated based on the data supplied by CORDIS and the Smart Specialisation Platform. Moreover, in order to tackle the relationship between FPs and regional development, NUTS 2 regions were classified into three groups: less developed regions, middle-income regions and developed regions. Our empirical evidence underlines different trends in this tool of the innovation policy mix. The general trend points to a positive correlation between the level of development and the capacity to attract FPs projects and funds. Therefore, FPs might contribute to reinforcing pre-existing innovation hubs and long-term growth disparities. Thus, coordination and participation in projects, as well as the funds allocated in the FPs are heavily concentrated in the developed regions. Middle-income regions attract more projects on average than less develop regions, although the disparities among them are not particularly high. Concerning less developed regions, there are two different groups of regions. One of them is characterized by a remarkable number of project coordinations that attract funds, even higher than some middle-income regions; while the other group shows a low number of coordinations or participations in projects. Comparing the 6th and the 7th FPs, we observe a slight reduction of the disparities, particularly due to the higher participation of regions from Spain, Portugal and Italy, which were among the hardest hit by the economic recession in Europe. This trend could be explained by the need to compensate the reduction of regional and national funds by means of being more active in capturing EU funds.
Keywords: Framework Programmes, innovation policies, cohesion policy, regional development, less developed regions
INTRODUCTION
The Framework Programmes stand out as one of the main instruments to foster research and innovation in the European Research Area since their launching in 1984 (Guzzetti, 1995; Dávid, 2016; Reillon, 2017). Likewise, several studies pointed out the spillover effects of the EU Framework Programmes (Vence, Guntín, & Rodil, 2000; Boldrin & Canova, 2001; Hudson, 2007; Reid, 2007; Rodil, Vence, & Sánchez, 2014). This instrument is aimed at promoting research, technological development and innovation across Europe by means of funding international consortia (European Commission, 2016; Dávid, 2016; Reillon, 2017). In this regard, its allocation rationality is mainly based on scientific excellence and industrial leadership and, therefore, it does not consider regional cohesion criteria. Given their increasing relevance in terms of financial support in the European budget (European Commission, 2018), it should be key to analyze the geographical distribution of projects and funds, as well as its recent trends. In other words, we are wondering which regions are the main beneficiaries of this instrument. This issue was mainly addressed from a historical and theoretical point of view, as well as at national levels (Vence, 1998; Vence et al., 2000; Dávid, 2016; Reillon, 2017; Izsák & Radošević, 2017; Özbolat & Harrap, 2018). Therefore, it might be valuable to shed light on the main recent dynamics of this instrument at the regional level.
The main aim of this paper is to analyze the spatial distribution of the coordination and participation in projects under the 6th and 7th Framework Programmes, as well as regarding the current Horizon 2020 (8th FP) funding. For this purpose, NUTS 2 regions are classified into three groups according to their economic development level in terms of GDP per capita. The methodology is based on a descriptive analysis of a database which contains information about coordination and participation in these projects. This comprehensive database was built by the authors from the CORDIS dataset, as well as regionalized at NUTS 2 level. Concerning the Horizon 2020, this study is based on the data from the Smart Specialisation Platform (European Commission, 2018). Given all these characteristics, this methodology represents a step ahead from previous analyses, which have hardly considered the geographical allocation of projects and funds regarding the level of regional economic development (Dávid, 2016; Izsák & Radošević, 2017).
The paper is structured in four sections. The first section deals with the dilemma between place-based and place-neutral policies pointed out by the literature on regional development policies. The following section introduces the spatial dimension of the EU research and innovation policy. In this regard, this section briefly describes the origin and evolution of the research and innovation policy in the EU and, later, it focuses on the Framework Programmes from the regional dimension. The third section shows the main results concerning the regional distribution of projects and funds from the 6th and 7th Framework Programmes and Horizon 2020. Finally, the last section approaches the discussion and the policy implications from the main results of this paper.
Place-based vs. place-neutral policies
One of the key debates within the field of regional development refers to the existence of two different approaches for public intervention: the so-called place-based and place-neutral perspectives. On the one hand, place-neutral approach argues that policies should target development problems with the same recipes regardless of the region characteristics. Promoting spatially-blind institutions (e.g., those defending property-rights), connectivity infrastructure and factors mobility would be the most effective way of generating growth and welfare for individuals. The fact that such measures might reinforce agglomerations does not constitute a real issue. Thus, the focus of these policies is increasing the welfare of individuals, regardless of which region they live in (Barca, McCann, & Rodríguez-Pose, 2012). This perspective, which is also coherent with a sectoral approach to policies, rests mainly on two studies: the so-called Sapir Report (Sapir et al., 2014) and the World Development Report Reshaping Economic Geography (World Bank, 2009).
On the other hand, the place-based approach assumes that the territorial context, understood in terms of social, cultural and institutional characteristics, matters for policy intervention. Moreover, it considers that policy design and implementation should involve local stakeholders for being effective. This view rests largely on the work An Agenda for a Reformed Cohesion Policy made by Barca (2009) for the European Commission, as well as on two OECD reports that highlight the relevance of regions in economic development (OECD, 2009a, 2009b). From a policy perspective, the particularities of regions make ineffective the “one-size-fits-all” approach and, for this reason, the place-based argument suggests that development strategies should focus on mechanisms that build on local capabilities and promote innovative ideas. Such ideas would come through the interaction of local and exogenous actors, sharing different knowledge basis, with the aim of overcoming local failures (González-López, Dileo, & Losurdo, 2014).
The place-based approach is used by the current EU cohesion policy (2014-2020) and particularly in the smart specialization strategies (S3), which are the theoretical foundation of this policy. In this way, EU regions must design and implement a S3 in order to receive structural funds. The S3 are based on a bottom-up process, where the main regional stakeholders participate, taking into account the specific characteristics of each region. Nevertheless, other EU policies do not follow a place-based approach, but they are rather sectorial and place-neutral. It is the case of the research and technology policy, and it is partially the case of the agricultural policy, which after recent reforms, shares both place-based and place-neutral approaches. In this regard, this paper analyzes the geographical distribution of the main instrument of the EU research and technological policy, the Framework Programmes (FPs) for research and innovation, which are an example of a space-blinded policy.
Our analysis links also with one of the on-going debates about EU policies, which regards the need for coordination between different policies and instruments and, particularly, their alignment with the cohesion objective of the EU (Begg, 2008; Rodríguez-Pose & Novak, 2013; Rodil, et al., 2014; Crescenzi, De Filippis, & Pierangeli, 2015; Foray, Morgan, & Radošević, 2018a, 2018b). In this way and referring to the EU RTD policy, Reillon (2017) points out that the need for spreading the benefits of the EU Framework Programmes to all regions remains a pending issue. Thus, the main criterion for selecting projects in the FPs has been excellent science, which would lead to the concentration of research and innovation capacities in some areas or regions.
The spatial dimension of the research and innovation policy
- The EU R&I policy: Origin and evolution
The research and innovation (R&I) policy in the European Union comes back to the mid-eighties when it was explicitly included in the title VI of the Single European Act (dedicated to “Research and Technological Development”). From that moment, research and technological policy becomes one of the formal community policies. Its aim is to strengthen the scientific and technological basis of European industry and to encourage it to become more competitive at international level (Guzzetti, 1995; Vence, 1998; Reillon, 2015, 2017). The EU R&I policy is based on a multilevel model because powers to implement policies are distributed among the different levels of government. Besides the national powers, some authors underline the increasing role played by the regional level (Landabaso, 2000; De Brujin & Lagendijk, 2005; Tödtling & Trippl, 2005; Fernández, Castro, & Zabala, 2007; Fernández, Mas-Verdu, & Tortosa, 2010). The interventions of the European Union in this field are based on the subsidiarity principle, supplementing the national and regional actions. In contrast to many other EU policies, which are implemented and executed by national governments, the majority of the EU innovation actions are directly implemented by the European Commission. They tend to consist of funding for research and innovation, additional to the regional and national budgets.
The Directorate General R&I is the Department of the Commission in charge of the EU policy on research, science, and innovation. However, due to the cross-cutting nature of innovation, other departments (also Directorates General) manage some innovation issues.
- The R&D Framework Programmes
The main instrument of the EU to foster research and technological development has been the multiannual R&D Framework Programmes (FPs). These programmes set the thematic priority areas for science and technology in a certain period. Since the Treaty of Maastricht, the FPs are not only a programming tool but also a financial tool (Guzzetti, 1995; Vence, 1998; Reillon, 2017). The 1st FP was launched in 1984 and focused on research in biotechnology, telecommunications and industrial fields. In this regard, fostering collaborative research arose at that moment as one of the main aims of this research and innovation instrument. The 4th FP 1994-1998 is the first one after the Maastricht Treaty and joins all the different and fragmented R&D community actuations in order to improve efficiency and coordination (Vence, 1998; European Commission, 2016). From the 5th FP onwards, proposals had to be submitted through an international consortium, and they had to prove a European-level impact (Dávid, 2016). These programmes continued until the 7th FP (2007-2013) (European Union, 2016), when they are ongoing through Horizon 2020 (also called the 8th Framework Programme for the period 2014-2020), with a budget of 77 billion euros. They have focused on funding research and innovation projects, promoting cooperation among disciplines, countries, and partners.
The evolution of the FPs (Table 1) shows an increasing budget, mainly from the 7th Framework Programme. These higher budgets highlight the growing relevance of research and innovation for the EU. Thus, the EU allocated less than 2% of its budget to research in 1981, while nowadays, it is roughly 7.5% (Reillon, 2017). Despite their main focus on research, it is noticed increasing attention to innovation issues in the EU policy. The increasing focus on the SMEs is another feature of this shift, as it is shown by the 7th FP, which is complemented by the Competitiveness and Innovation Programme (€3.6 billion) (Rodil, 2007). Concerning the agents involved, universities accounted for the bulk of the funding from the 7th FP, reaching 44% of the total. Other relevant actors are research and technology organizations, SMEs and large private firms, which mean 27%, 13% and 11% of the total funds, respectively (Dávid, 2016).
Table 1. Timeline of FPs and their budgets
Framework Programme
Period
Budget (€ Billon)
1st Framework Programme
1984-1987
3,74
2nd Framework Programme
1987-1991
5,36
3rd Framework Programme
1990-1994
6,60
4th Framework Programme
1994-1998
13,12
5th Framework Programme
1998-2002
14,96
6th Framework Programme
2002-2006
17,50
7th Framework Programme
2007-2013
53,20
8th Framework Programme (Horizon 2020)
2014-2020
74,80
Source: own elaboration based on European Commission.
The current EU FP is called Horizon 2020, and it corresponds to the 8th FP. It is launched in the context of the Europe 2020 Strategy, addressing three main issues: excellent science, industrial leadership, and tackling societal challenges. Horizon 2020 gathers all its R&I funding from the EU, including the European Institute of Innovation & Technology (EIT) initiatives. Its scope is broad, because it provides funding from the idea to the market, covering research and innovation. This programme is not only structured by thematic areas, but also by challenges. In this regard, the main challenges are social ones, such as health, clean energy or transport. Finally, Horizon 2020 attempts to simplify the procedures and rules of the funding, making it easier to apply for and access grants for all participants, as well as reducing bureaucracy and time.
- The regional dimension in the EU Framework Programmes
As pointed out above, the FPs are mainly based on excellent science and industrial leadership. Although there were some attempts to introduce a criterion concerning greater cohesion in the selection criteria, mainly based on the idea of leveraging synergies between these programmes and the structural funds (Corpakis, 2016; De Carli, 2017; Reillon, 2017), this is still a pending issue. This situation led to the creation of instruments under Horizon 2020, whose objectives are to ‘spread excellence’ and ‘widen participation,’ but with a very limited budget (less than 2% of the Horizon 2020 budget) (Reillon, 2017). As pointed by this author, there is a conflict between the excellence and the cohesion criteria, as the application of the excellence criterion tends to lead to a concentration of research and innovation capacities in some areas or regions. Some studies have shown that well-developed regions attract a large share of such funds (Commission of the European Communities, 1993, 1994; Vence, 1998; Özbolat & Harrap, 2018).
Moreover, most of the cases show a positive relationship between participation and returns with the level of R&D expenditure, both at national/regional levels and agent level. This implies that this kind of policies might have an important feedback effect on pre-existing regional disparities. Therefore, the uneven regional distribution of EU innovation policy has not only effects in the short term, but also in the long term, due to the cumulative character of innovation. Likewise, there is feedback between the participation in R&I activities and the building of regional innovation capacities and learning (Vence, 1998; Rodil, 2007). In any case, Rodríguez-Pose (2018) argues that if policy intervention is place-sensitive through considering specific regional development strategies, it could balance excellence criteria as well as regional cohesion aims.
Spatial analysis of the Framework Programmes
European integration aims to achieve sustained growth based on higher levels of competitiveness. Likewise, it also considers social and territorial cohesion as one of its main targets. Even though these aims may be compatible (Rodríguez-Pose, 2018), it would be complex to reach them simultaneously (Rodil et al., 2014). A divergent path might lead to an increase in competitiveness, but at the cost of the cohesion and regional development (Begg, 2008; Cornett & Sørensen, 2008; Rodríguez-Pose & Novak, 2013; Rodil et al., 2014; Foray et al., 2018a, 2018b; Özbolat & Harrap, 2018). Thus, it is advisable to wonder whether the current dynamics of the spatial distributions of the FPs foster both innovation and territorial cohesion.
This section addresses the geographical distribution of the participation and coordination of research and technological development projects under the 6th and 7th FPs (2002-2013). Likewise, current geographical trends of the investments allocated under Horizon 2020 (2014-May 2017) are analyzed in the second subsection. This study considers useful to differentiate between coordination and participation in projects because coordination usually requires more capabilities than participation.
METHODOLOGY
The methodological framework is based on the descriptive analysis of a comprehensive database elaborated by the authors from the CORDIS dataset. It includes a wide array of information regarding the research and technological development projects funded by the European Union under the 6th and 7th FPs. In this regard, projects are classified regarding the role played by the different agents involved, that is coordination and participation. The authors regionalized these data at NUTS 2 level and later organized them into the analyzed FPs and regions. Likewise, the NUTS 2 breakdown was harmonized in order to maintain geographical coherence over time. Complementarily to CORDIS, the database used in this study is also based on information from Eurostat regarding regional economic development. Concerning the Horizon 2020 programmes, data are gathered from the Smart Specialisation Platform (European Commission). The elaborated comprehensive database makes easier the analysis of the geographical distribution of the different instruments addressed in this paper at NUTS 2 level, as well as enlightening the main insights of these tools regarding regional economic development.
The database used in this study regionalizes data from more than 140,000 projects under the 6th and 7th FPs. Moreover, all the projects are classified into 276 regions, following the NUTS 2013 classification at level 2. It should be noted that the CORDIS dataset did not provide NUTS 2 codes. Therefore, it was required to regionalize each project based on the available geographical information in that dataset. As a result, the database is filtered in order to quantify the number of coordinations and participations in projects under both FPs per each NUTS 2 region. In this regard, Table 2 summarizes the number of projects, as well as the number of regions analyzed in each FP. As it is shown, the total number of projects increased sharply to 42.7% between the 6th and 7th FPs.
Table 2. Summary statistics of the granted projects in the 6th and 7th FPs
|
Number of projects |
Number of regions (NUTS2) |
|
|
6th FP |
57,984 |
276 |
|
7th FP |
82,770 |
276 |
Source: own elaboration based on CORDIS.
- Regional participation in the 6th and 7th Framework Programmes
Concerning the total breakdown between the coordination (Cfp) and participation (Pfp) in the FPs, Table 3 depicts descriptive statistics regarding the total and the average number of coordinations and participations in projects per region, as well as the standard deviation and the minimum and maximum values. As a first approximation, it should be pointed out that projects under both FPs are unevenly distributed geographically. Furthermore, this uneven distribution is higher in the coordination than in the participation in projects. However, there is a slight reduction in the geographical concentration between the 6th and the 7th FPs.
Table 3. Summary statistics of coordination and participation in projects in the 6th and 7th FPs
|
Sum |
Mean |
Std. Dev. |
Min |
Max. |
|
|
Cfp6 |
8,540 |
30.94 |
66.27 |
0 |
848 |
|
Pfp6 |
49,444 |
62.52 |
129.85 |
0 |
1,534 |
|
Cfp7 |
17,255 |
179.14 |
322.08 |
0 |
3,717 |
|
Pfp7 |
65,515 |
237.37 |
419.78 |
0 |
4,547 |
Note: Cfp6 and Cfp7 mean coordination of projects under 6th and 7th Framework Programmes, respectively. Pfp6 and Pfp7 mean participation in projects under 6th and 7th Framework Programmes, respectively.
Source: own elaboration based on CORDIS.
One complimentary way to analyze the concentration of the coordination and participation in the different projects under the analyzed FPs could be the Herfindahl index. An index value close to 1 means heavy concentration and 0, otherwise. Equation 1 shows it in mathematical terms

(1)
where  is the share of region
  in the total of coordination and participation in projects. As Table 4 shows, coordination and participation in the sum of the two FPs show a moderate concentration (0.019 and 0.015; respectively), but the concentration is higher in the case of the coordination in projects. Moreover, the concentration of the coordination in projects slightly reduces between the sixth (0.020) and seventh FPs (0.019). The same trend is described in the participation in projects: from 0.0153 to 0.0149.
Table 4. Geographical concentration of coordination and participation in projects through the Herfindahl index
|
Cfp6 |
Cfp7 |
Pfp6 |
Pfp7 |
Cfp6-Cfp7 |
Pfp6-Pfp7 |
|
|
H index |
0.02018 |
0.01920 |
0.01529 |
0.01491 |
0.01933 |
0.01502 |
Note: Cfp6 and Cfp7 mean coordination of projects under 6th and 7th Framework Programmes, respectively. Pfp6 and Pfp7 mean participation in projects under 6th and 7th Framework Programmes, respectively.
Source: own elaboration based on CORDIS.
Tables 5 and 6 highlight some descriptive statistics of the coordination and participation in FP projects, in terms of the regional economic development and the population. For this purpose, all the regions were classified into three different groups regarding their regional GDP per capita in PPS in comparison with the EU-28 average. The first group, called “less developed regions” (LDR) includes all the regions below 75% of the EU average. The next category called “middle-income regions” (MIR), encompasses those regions between 75 and 100% of the EU average. Finally, “developed regions” (DR) includes all the regions above the EU average. In this way, this differentiation regarding regional economic development makes easier to analyze spatial singularities. In addition, Tables 5 and 6 show the level of regional economic development in 2000, 2009 and 2015; given that these years represent two years before the starting of the 6th FP, one year after the beginning of the economic recession and two years after the end of the 7th FP, respectively. Likewise, the number of coordinations and participations in projects is expressed per million of inhabitants.
According to Tables 5 and 6, some patterns can be drawn from the geographical distribution of the coordination and participation in projects, in terms of the regional economic development. Firstly, the coordination and participation in the FPs, per million of inhabitants, go hand in hand with the level of regional economic development during the whole period analyzed. As it is shown in these tables, developed regions outperform the other in terms of the average number of coordinated and participated projects. This phenomenon is expected because the ability of coordinating or participating in international projects is a function of long-term research and innovation (R&I) capabilities, which are the foundations of long-term economic growth. The same occurs between middle income and less developed regions, except for the 7th FP.
Secondly, less developed regions show higher levels of disparities in the coordination and participation in projects in comparison with the other two groups of regions, which are more homogenous, especially the developed regions. In this regard, R&I capabilities and infrastructure, as well as the effect of previous support policies and expertise, might explain these two different patterns. This pattern may resemble the Mathew’s effect in which success breeds success (Merton, 1968). As the virtuous circles of the Mathew’s effect, Myrdal (1957) asserts that more developed regions are more able to attract investment, employment, and new activities than less developed regions. In this regard, regional partners face difficulties and barriers to apply and participate in FPs, at least for the first time. This fact could be linked with the absorption capacity, which tends to be low in less developed regions (Tesfaye & Kitaw, 2018; Pelikánová, 2019). Therefore, it is needed to build these capabilities. However, it should be noted that many less developed regions coordinated or participated in more projects per million of inhabitants, than many middle-income regions, especially in the 7th FP. This interesting issue needs further research that is beyond the aim of this paper.
Moreover, there can be other qualitative criteria (even not formal), which are considered in the evaluation of applications (such as a broad geographical consortium, the composition of the network, former collaborations). Balland and Ravet (2018) analyze the networks involved in the FPs from the 6th FP until the ongoing Horizon 2020, from a dynamic perspective. They show that different factors, such as cultural and geographical proximity, play an important role in shaping the structure of the network. Moreover, they find a high dynamic and relatively open network of partners over time, although there are some persistently peripheral countries (Balland & Ravet, 2018).
Despite some authors underline the negative effects of the 2008 financial crisis on R&I funds and policies in Southern and, to a lesser extent, Central-Eastern Europe (Izsák & Radošević, 2017), there is no global evidence regarding the FPs. In this way, there are negative and statistically significant correlations between the variation of GDP per capita in 2009-2015 and the coordination and participation in projects per million of inhabitants. However, it would also be advisable to analyze this evolution in more detail with the specific data of these geographical areas.
Going into detail of the specific regional data at NUTS 2 level, Figure 1 describes the sum of the coordinated projects under the 6th and 7th FPs per million of inhabitants in each region. It should be noted that the number of regions in each category appears in brackets in the legend. Firstly, this figure emphasizes the concentration of coordinated projects around a few hubs. Most of them are identified with the highest per capita income regions, such as Bavaria (DE21), Ile-de-France (FR10), Brussels (BE10), Wien (AT13), Copenhagen (DK01), Greater London (UKI) or Vlaams-Brabant (BE24). Despite their income per capita below the average, there are some unexpected results regarding some regions in Greece (EL41, EL43, EL53, EL54), which show a high number of coordinated projects per million of inhabitants. With a GDP per capita between 49% and 67% of the European average, they represent a good example of the aforementioned group of regions with an outstanding performance in the coordination of projects. Concerning regions in the European GDP per capita average, East Anglia (UKH1) stands out as one of the leaders in terms of coordinated projects. These results are in line with previous studies, which pointed out that the bulk of the projects are allocated in the three main regions in each country (Commission of the European Communities, 1993, 1994; Vence, 1998).
In addition, many less developed regions stand out in the second level of hubs in terms of coordinated projects (between 100 and 200 projects per million of inhabitants). Once again, some Greek regions (EL52, EL61, EL63) show very acceptable performance in comparison with their economic performance. Moreover, the case of South Yorkshire (UK3) should be noted, which coordinated more than 108 projects per million of inhabitants in the 6th and 7th FPs, but its GDP per capita was below 75% of the EU average in 2015. The third level of regions from the top (between 50 and 100 projects per million) constitutes the “middle class.” In the same way, as in the first and second level, the developed, or middle-income regions take the lion’s share. However, few less developed regions were able to enter in this level, such as the case of Estonia (EE00), North East England (UKC1) or Eastern Macedonia and Thrace (EL51). Finally, there is a large group of developed and middle-income regions with a weak performance, due to these regions coordinate less than 50 projects per million of inhabitants.
Figure 2 depicts the number of participations in projects in both FPs per million of inhabitants. As mentioned above in the summary statistics in Table 3, this figure shows less concentration than the coordinated projects. In this regard, this map paints a uniform color across the EU. In any case, there are also some important hubs with a high concentration of participation in projects in both FPs, such as Wien (AT13), Brussels (BE10), Valle d’Aosta (ITC2) and Ljubljana (SI04). All of them are developed or middle-income regions as in the last case. However, the Greek region of Epirus (EL54) also stands out as one of the main hubs with 1,037 participations in projects per million of inhabitants in the 6th and 7th FPs. Figure 1, and to a lesser extent Figure 2, demonstrate the high concentration of projects around capital states and other relevant economic cities. This is the case in France, Hungary, Romania, Spain, Portugal and Germany.
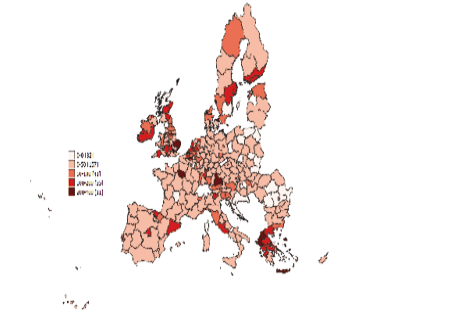
Figure 1. Number of coordinated projects under the 6th and 7th FPs per million of inhabitants
Note: Hereinafter, the number of regions is in brackets.
Source: own elaboration based on CORDIS.
Developed and middle-income regions represent the bulk of the second level (regions between 200 and 1000 participations in projects per million of inhabitants). Some less developed regions highlight, such as the capital city Sofia (BG41), Estonia (EE00) and South Yorkshire (UK3). Moreover, eight Greek regions also stand out to this respect (EL41, EL43, EL51, EL52, EL53, EL61, EL63, EL64). It is advisable to underline that many of these Greek regions underwent a severe downgrading in their levels of GDP per capita between 2009 and 2015. Despite the effects of the economic recession, these regions might have partially kept previous R&I capabilities in order to participate and coordinate European projects.
Regarding the coordinated projects, it could be useful to analyze the geographical distribution of the 6th and 7th FPs, as well as its evolution. Comparing Figures 3 and 4 makes this task easier, especially concerning different regional patterns. At a glance, there was a general reduction of the polarization of the coordinated projects between the two FPs. In this way, a moderate reduction takes place in the regions with projects between 0 and 10, and 10-50. Furthermore, there was a slight reduction in the regions without projects. Likewise, the number of regions with more than 50 projects per million of inhabitants increased sharply. In any case, this general trend should be nuanced, because the general budget and the number of projects have also increased between the two FPs.
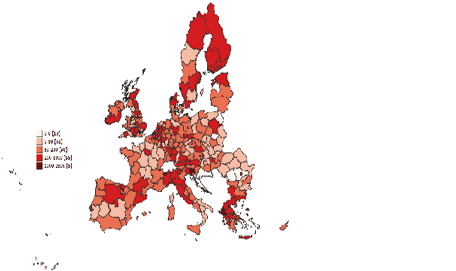
Figure 2. Number of participations in projects under the 6th and 7th FPs per million of inhabitants
Source: own elaboration based on CORDIS.
Spain, Portugal and Germany show a more well-balanced distribution at regional level of coordinated projects in the 7th FP in comparison with the previous one. These countries could upgrade several regions and reduce the differences with the capital state or the most dynamics economic hubs. France and Sweden are clear exception of this trend, in which the polarization in the coordinated projects remains stable or even increased in the 7th FP.
Regarding the participation in projects, Figures 5 and 6 enlighten the evolution of the geographical distribution of the participation in projects, which makes the identification of different patterns easier. These figures show a slight reduction in the concentration of the participation in projects between the 6th and 7th FPs. Looking into detail, the number of regions at first and second bottom levels (between 0 and 100 participated projects per million of inhabitants) moderately reduces. This trend is combined with a proportional increase in the regions included in the next two levels, remaining unchanged those regions above 800 projects per million of inhabitants.
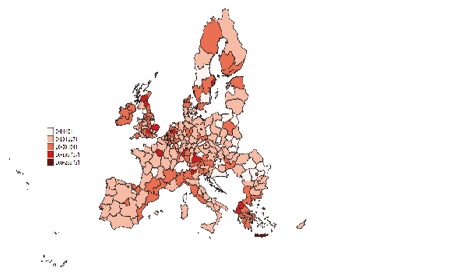
Figure 3. Number of coordinated projects under the 6th FP per million of inhabitants
Source: own elaboration based on CORDIS.
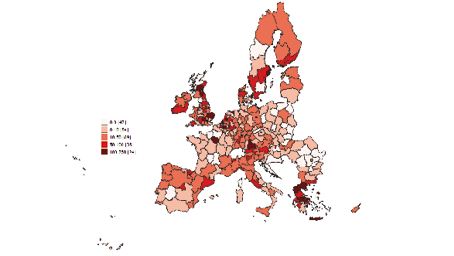
Figure 4. Number of coordinated projects under the 7th FP per million of inhabitants
Source: own elaboration based on CORDIS.
Concerning specific national patterns, Southern Europe is characterized by a reduction in the concentration of the participation in projects and the upgrading process of their less developed regions. This phenomenon is evident in Spain, Portugal, Italy and Greece. In this regard, there is no evidence of a negative impact of the economic recession in the participation of these countries during the 7th FP. In addition, the same trend is evident in Northern Europe, such as in the case of Finland, Ireland, the United Kingdom and Latvia. However, France and many areas in Central-Eastern Europe tend to maintain their geographical distribution of the participation in projects over time.
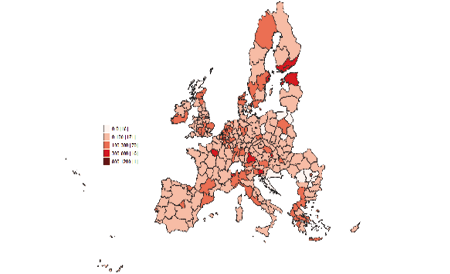
Figure 5. Number of participations in projects under the 6th FP per million of inhabitants
Source: own elaboration based on CORDIS.
The descriptive analysis carried out in this subsection enables us to shed light on the main geographical features and trends of the 6th and 7th FPs. In order to complement this overview, it would be advisable to examine the ongoing FP: the 8th FP also called Horizon 2020. This last task makes easier a comprehensive comparison of these competitive-oriented R&I European policies.
.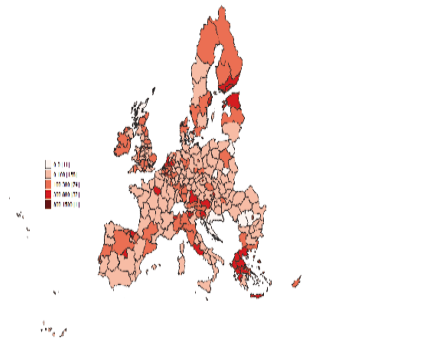
Figure 6. Number of participations in projects under the 7th FP per million of inhabitants
Source: Own elaboration based on CORDIS.
- Regional funds from Horizon 2020
Horizon 2020 (H2020) is the ongoing FP, which provides support for R&I initiatives during the period 2014-2020. It accounts for 77 billion euros, being one of the main instruments to foster the European Research Area (European Commission, 2018). The main aim of this subsection is to analyze the main geographical features of the funds allocated by H2020 through the last available data (May 2017) in terms of regional economic development. As H2020 is the ongoing FP, final data is not available regarding the geographical distribution of coordination or participation in projects.
Table 7 shows the summary statistics related to the total H2020 funding per capita regarding regional economic development in 2015. Firstly, it should be noted that these funds are more concentrated in the DRs in comparison with MIRs and LDRs. On average, DRs have received almost five times more financial resources than LDRs and more than three times than MIRs. This expected feature of H2020 supports the pattern described in the 6th and 7th FPs. Comparing the dispersion of values among the three levels of economic development, LDRs are more heterogeneous than the other two groups. In fact, dispersion is inversely proportional to GDP per capita. It is advisable to underline that LDRs have captured more funds than MIRs because of the former accounts for 92 regions and the latter for 36.
Table 7. Summary statistics of H2020 funding in euros per capita per year allocated until May 2017 regarding regional economic development in 2015
|
Sum |
Mean |
Std. Dev. |
Min. |
Max. |
|
|
LDR |
416.69 |
4.79 |
6.97 |
0.06 |
35.16 |
|
MIR |
285.08 |
7.92 |
6.83 |
0.87 |
26.40 |
|
DR |
1,644.19 |
22.22 |
17.21 |
1.28 |
106.59 |
Source: own elaboration based on the Smart Specialisation Platform (European Commission).
The dispersion of the allocated funds in LDRs can be mainly explained again by the performance of some Greek regions. In order to unveil this geographical feature, Figure 7 shows the spatial allocation of this funding. These data were gathered from the Smart Specialisation Platform (European Commission). It should be noted that there are some missing values from two Greek regions because they are not available in the official dataset. Regardless of this deficiency, this map sheds light on the different geographical patterns. In this way, the lion’s share of the regions with more funds per capita (above 16.4 €) are classified as DRs. This is supported by previous analyses of the 6th and 7th FPs, more focused on the distribution across countries (Commission of the European Communities, 1993, 1994; Vence, 1998; Vence et al., 2000; Dávid, 2016; Reillon, 2017; Izsak & Radošević, 2017; Özbolat & Harrap, 2018), as well as for the sources of long-term economic growth. Some regions constitute exceptions to this rule, such as the case of Central Macedonia (EL52), Western Greece (EL63), Crete (EL43), Estonia (EE00) and Slovenia (SI). These cases are in line with the trends mentioned above in the 6th and 7th FPs. Furthermore, there is a group of DRs with relatively low performance in the attraction of funds in H2020. They are below 7.3 euros per capita, which means that their performance is more in line with LDRs or MIRs. This is the case in Vorarlberg (AT34), Rhineland-Palatinate (DEB), Schleswig-Holstein (DEF), Sjælland (DK02), Valle d’Aosta (ITC2), Veneto (ITH3), Småland med öarna (SE21) and Norra Mellansverige (SE31).
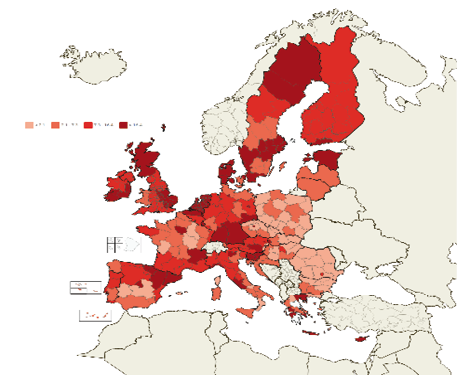
Figure 7. Total H2020 funding per capita per year allocated until May 2017
Source: Smart Specialisation Platform (European Commission).
DISCUSSION AND POLICY IMPLICATIONS
The Framework Programmes stand out as the main supranational instruments to foster R&D and innovation within the European Research Area. Given that Horizon 2020 currently accounts for roughly 6.9% of the total EU budget (European Commission, 2018), it plays a relevant role in supporting the foundations for long-term regional economic growth. Its relative importance might be even more crucial in a situation of a general decrease of national support in many areas due to the financial crisis (Izsák, Markianidou, & Radošević, 2013; Izsák & Radošević, 2017) and an increasingly fierce international competition for funds (Dávid, 2016). For this reason, regional distribution of projects and funds are key to upgrade regional innovation capabilities and long-term economic growth.
The results of analyzing the geographical allocation patterns of coordination and participation in projects under the 6th and 7th FPs, as well as Horizon 2020 funds, underline that the main beneficiaries are the developed regions. Thus, the number of projects per million of inhabitants under the 6th and 7th FPs in those regions is practically triple the figures of the rest of regions. In the same vein, the funds per inhabitant coming from H2020 until May 2017 managed by developed regions were more than four times greater than the ones managed by less developed regions.
It is expected that if the lion’s share of the projects and funds are allocated in those areas, the FPs are boosting pre-existing innovation hubs and, therefore, enhancing long-term growth disparities. This outcome is a direct consequence of the design of this supply-side instrument, which aims at fostering excellent science and industrial leadership with a spatially blinded criterion. Such unequal allocation of projects and funds could hinder regional cohesion and even long-term growth. Thus, as pointed out by Rodríguez-Pose (2018), a structurally uneven regional economic growth could be self-defeating, in terms of well-being, inequality and even social peace. And although some authors have highlighted the role of spillover effects from big agglomerations to less developed regions, empirical evidence is not unanimous at all and, therefore, agglomeration could hardly sustain economic growth and prosperity in the long-term (Tomaney, Pike, & Rodríguez-Pose, 2010; McCann, 2016).
Moreover, concerning the impact of the economic recession of 2008 on the allocation of projects and funds from the FPs, empirical evidence indicates that it has not had an apparent negative effect on the attraction capacity of those regions more hit by the crisis. Many Southern economies, such as Spain, Portugal or Italy, shows a more well-balanced interregional portfolio between the 6th and the 7th FPs. The explanations could be, on the one hand, that the regional innovation systems of these economies might have overcome the negative hits from the aforementioned crisis. According to this, these regions still have enough technological capabilities in order to coordinate and participate in projects under the FPs. Nevertheless, the negative effects of the 2008 crisis on innovation systems may be seen in the long term, instead of in the short term, mainly in some critical areas such as human resources, technological facilities or the critical mass of agents.
On the other hand, the general decline in national financial support could lead to an increase in the participation of these less developed regions in the FPs; therefore, it is just a matter of necessity and searching for alternative sources of funding. This last hypothesis is in line with some trends described by Izsák et al. (2013), Dávid (2016), or Izsák and Radošević (2017). However, it is vital to ask if European funding from FPs might compensate for the reduction of national support in less developed regions, especially, when these areas are not able to attract the same number of projects and funds than the developed ones. This issue is crucial in order to close the regional gap regarding disparities in terms of innovation capabilities.
In any case, and despite the relatively better performance of some southern regions, an enormous concentration of resources coming from the EU RTD policy in highly developed regions remains. This issue raises the debate about redesigning this policy with an alternative rationale. In this regard, we agree with authors like Reillon (2017), who recommends increasing the relevance of place-sensitive criteria in the EU innovation policy in order to foster regional cohesion aims. From our point of view, it is advisable to shift the focus from place-blinded policies to other kinds of policies that take into account regional potentialities and capabilities, in order to develop new opportunities (Rodríguez-Pose, 2018).
In particular, FPs could be an instrument that balances efficiency and cohesion by means of supporting innovation and the development of new related activities also in less developed regions. FPs should be redesigned in order to consider interregional disparities in terms of economic development and innovation capabilities, as well as the long-term accumulation effects that stem from the FPs. Combining the excellence criteria with the cohesion criteria, i.e., favoring the participation of less developed regions in the projects and networks funded, could be a good option that might also facilitate spillover effects. This could also be achieved by designing the general challenges of the FPs, as well as the project thematic according to a European portfolio of regional smart specialization strategies. As a result, there could be more synergies between FPs and European Structural Investment Funds (ESIFs), which are more dependent on income per capita levels. In this hypothetical scenario, there would be more opportunities for a homogenous geographical distribution of projects, because FPs would balance innovation and industrial leadership criteria, well-being measures and the regional untapped potential.
CONCLUSION
Framework Programmes stand out as one of the main supply-side instruments aimed at fostering research and innovation in the European Research Area. Given their relevance in terms of financial support in the European budget, as well as in the innovation capabilities and long-term growth, it is advisable to know the geographical distribution in the EU, especially regarding regional economic development. This paper has addressed this issue by means of a comprehensive analysis of the regional allocation of coordination and participation in projects under the 6th and 7th FPs, as well as of the funds allocated in the ongoing Horizon 2020.
Empirical evidence underlines that developed regions account for the bulk of the coordination and participation in projects and the funds from the FPs instrument. In this way, such unevenly geographical distribution of projects and funds leads to the reinforcement of pre-existing industrial and innovation hubs. In this regard, enhancing research and innovation networks and capabilities in well-established hubs can only trigger the maintenance or the increase of regional disparities. This is the result of a place-blinded intervention, which does not consider any regional singularity. This issue raises the debate about the redesign of such policy with an alternative rationale, giving more relevance to place-sensitive criteria in order to foster regional cohesion aims.
Moreover, there is a slight trend towards the reduction of the concentration in the participation in projects and the attraction of funds. This remarkable feature mainly takes place in many areas in Southern Europe and Germany and, to a lesser extent, in some regions in Northern and Central-Eastern Europe. In the case of Southern Europe, this trend might be paradigmatic due to Spain, Portugal and Italy having undergone a wide array of economic restrictions since the 2008 economic recession. As pointed out by other authors, the increasing participation could be a result of a special effort aimed at compensating the reduction in national financial support.
Regarding further research, firstly it is important to improve the comparison among the 6th and 7th FPs with the ongoing Horizon 2020 by means of building a whole database with the regionalized data of the coordination and participation in projects. It makes a more homogenous comparison among them easier. Given that Horizon 2020 is ongoing, it is currently a complex task to unify all the data from the three FPs. Secondly, future extensions of this study should also address the impact of FPs on innovation capabilities at the regional level. This issue is crucial to shed light on the policy assessment dimension and enrich the debate regarding the geographical distribution of the support provided by the FPs. Moreover, it is necessary to enlighten the reasons behind the over-performance of the Greek regions under the 6th and 7th FPs.
Acknowledgments
The Erasmus+ Programme of the European Union Project EURIPER (EU Regional Innovation Policies and Peripheral Regions), under grant number 587410-EPP-1-2017-1-ES-EPPJMO-PROJECT, supported this work.
References
Balland, P.A., & Ravet, J. (2018). Dynamic Network Analysis of the EU R&I Framework Programme. Brussels: European Commission. https://doi.org/10.2777/651302
Barca, F. (2009). An agenda for cohesion policy: A place-based approach to meeting Europe Union challenges and expectations (Independent Report prepared at the request of Danuta Hübner, Commissioner of Regional Policy). Retrieved from http://www.europarl.europa.eu/meetdocs/2009_2014/documents/regi/dv/barca_report_/barca_report_en.pdf
Barca, F., McCann, P., & Rodríguez-Pose, A. (2012). The case for regional development intervention: Place-based versus place-neutral approaches. Journal of Regional Science, 52(1), 134-152. https://doi.org/10.1111/j.1467-9787.2011.00756.x
Begg, I. (2008). Structural policy and economic convergence. CESifo Forum, 9(1), 3-9.
Boldrin, L., & Canova, F. (2001). Inequality and convergence in Europe’s regions. Reconsidering European regional policies. Economic Policy, 16(32), 207-253.
Commission of the European Communities. (1993). Cohesion and RTD Policy. Synergies between research and technological development policy and economic and social cohesion policy. Communication from the Commission to the Council and the European Parliament, COM (1993) 203 final. Brussels: European Commission.
Commission of the European Communities. (1994). The European Report on Science and Technology Indicators 1994 (ERSTI). Brussels: European Commission.
CORDIS. European Commission. (2018, June). EU research projects under FP6 and FP7. Retrieved from https://cordis.europa.eu/projects/home_en.html
Cornett, A.P., & Sørensen, N.K. (2008). International vs. intra-national convergence in Europe – An assessment of causes and evidence. Investigaciones Regionales, 13, 35-53.
Corpakis, D. (2016). Fostering synergies between Horizon 2020 and Cohesion policy. Retrieved from https://www.kpk.gov.pl/wp-content/uploads/2016/07/synergie-2016-03-17.pdf
Crescenzi, R., De Filippis, F., & Pierangeli, F. (2015). In tandem for cohesion? Synergies and conflicts between regional and agricultural policies of the European Union. Regional Studies, 49(4), 681-704. https://doi.org/10.1080/00343404.2014.946401
Dávid, Á. (2016). The participation of Austria and Hungary in the Framework Programmes for research and technological development of the European Union. A comparative analysis. Romanian Journal of European Affairs, 16(4), 48-67.
De Brujin, P., & Lagendijk, A. (2005). Regional innovation systems in the Lisbon strategy. European Planning Studies, 13(8), 1153-1172. https://doi.org/10.1080/09654310500336519
De Carli, M. (2017). SEWP and Seal of excellence: Fostering synergies. Retrieved from http://s3platform.jrc.ec.europa.eu/documents/20182/205894/2.+M+de+CARLI.pdf/0fda6eb5-85ee-4a6c-b4b5-8cbbf4678117
European Commission. (2016). The EU explained: Research and innovation. Luxembourg: Publications Office of the European Union.
European Commission. (2018, October). Horizon 2020. Retrieved from https://ec.europa.eu/programmes/horizon2020/en/what-horizon-2020
European Commission. (2018, July). Smart Specialisation Platform. Retrieved from http://s3platform.jrc.ec.europa.eu/synergies-tool
Fernández, I., Castro, E., & Zabala, M. (2007). Estrategias regionales de innovación: El caso de regiones europeas periféricas. In X. Vence (Ed.), Crecimiento y políticas de innovación. Nuevas tendencias y experiencias comparadas (pp. 157-189). Madrid: Pirámide.
Fernández, I., Mas-Verdu, F., & Tortosa, E. (2010). Regional innovation policies: The persistence of the linear model in Spain. The Service Industries Journal, 30(5), 749-762. https://doi.org/10.1080/02642060802398093
Foray, D., Morgan, K., & Radošević, S. (2018a). The role of smart specialization in the EU research and innovation policy landscape. Retrieved from https://ec.europa.eu/regional_policy/sources/docgener/brochure/smart/role_smartspecialisation_ri.pdf
Foray, D., Morgan, K., & Radošević, S. (2018b). From rivalry to synergy: R&I policy and cohesion policy. Retrieved from https://ec.europa.eu/regional_policy/sources/docgener/brochure/smart/rivalry_synergies.pdf
González-López, M., Dileo, I., & Losurdo, F. (2014). University-industry collaboration in the European regional context: The cases of Galicia and Apulia region. Journal of Entrepreneurship, Management and Innovation, 10(3), 57-88. https://doi.org/10.7341/20141033
Guzzetti, L. (1995). A Brief History of European Union Research Policy. Luxembourg: Office for the Official Publication of the European Communities.
Hudson, R. (2007). Regions and regional uneven development forever? Some reflective comments upon theory and practice. Regional Studies, 41(9), 1149-1160. doi: 10.1080/00343400701291617
Izsák, K., & Radošević, S. (2017). EU research and innovation policies as factors of convergence or divergence after the crisis. Science and Public Policy, 44(2), 274-283. https://doi.org/10.1093/scipol/scw063
Izsák, K., Markianidou, P.M., & Radošević, S. (2013). Lessons from a Decade of Innovation Policy. What can be learnt from the INNO Policy TrendChart and The Innovation Union Scoreboard. Luxembourg: Office for the Official Publication of the European Communities.
Landabaso, M. (2000). Las nuevas políticas regionales de promoción de la innovación en la Unión Europea. Economía Industrial, 335-336, 51-66.
McCann, P. (2016). The UK Regional-national Economic Problem. Geography, Globalisation and Governance. London: Routledge.
Merton, R. K. (1968). The Matthew effect in science. Science, 159, 56-63. https://doi.org/10.1126/science.159.3810.56
Myrdal, G. (1957). Economic Theory and Underdeveloped Regions. London: Duckworth.
OECD. 2009a. How Regions Grow. Paris: Organisation for Economic Growth and Development.
OECD. 2009b. Regions Matter: Economic Recovery, Innovation and Sustainable Growth. Paris: Organisation for Economic Growth and Development.
Özbolat, N.K., & Harrap, N. (2018). Addressing the innovation gap: Lessons from the Stairway to Excellence (S2E) project. Luxembourg: Publications Office of the European Union.
Pelikánová, R.M. (2019). R&D expenditure and innovation in the EU and selected member states. Journal of Entrepreneurship, Management and Innovation, 15(1), 9-30. https://doi.org/10.7341/20191511
Reid, A. (2007). Innovation and regional development, do European structural funds make a difference? European Planning Studies, 15(7), 961-983. https://doi.org/10.1080/09654310701356696
Reillon, V. (2015). Overview of EU funds for research and innovation. Retrieved from http://www.europarl.europa.eu/RegData/etudes/BRIE/2015/568327/EPRS_BRI%282015%29568327_EN.pdf
Reillon, V. (2017). EU Framework Programmes for Research and Innovation. Evolution and Key Data from FP1 to Horizon 2020 in view of FP9. Brussels: European Parliamentary Research Service.
Rodil, Ó. (2007). Innovación y competitividad en la Unión Europea: Las nuevas políticas europeas en el período 2007-2013. In X. Vence, Crecimiento y políticas de innovación. Nuevas tendencias y experiencias comparadas (pp. 101-124). Madrid: Pirámide.
Rodil, Ó.; Vence, X., & Sánchez, M.C. (2014): Disparidades en la Eurozona: El debate de la convergencia regional a la luz de las asimetrías en la estructura productiva. Ekonomiaz: Revista Vasca de Economía, 86, 274-305.
Rodríguez-Pose, A. (2018). The revenge of the places that don’t matter. Cambridge Journal of Regions, Economy and Society, 11(1), 189-209. https://doi.org/10.1093/cjres/rsx024
Rodríguez-Pose, A., & Novak, K. (2013). Learning processes and economic returns in European cohesion policy. Investigaciones Regionales, 25, 7-26.
Sapir, A., Aghion, P., Bertola, G., Hellwig, M., Pisani-Ferry, J., Rosati, Viñals, J., Wallace, H., Buti, M., Nava, M., & Smith, P.M. (2004). An Agenda for a Growing Europe: The Sapir Report. Oxford: Oxford Scholarship.
Tesfaye, G., & Kitaw, D. (2018). An innovation capability development process for firms in developing countries: A theoretical conceptual model. Journal of Entrepreneurship, Management and Innovation, 14(3), 87-110. https://doi.org/10.7341/20181434
Tödtling, F., & Trippl, M. (2005). One size fits all? Towards a differentiated regional innovation policy approach. Research Policy, 34(8), 1203-1219. https://doi.org/10.1016/j.respol.2005.01.018
Tomaney, J., Pike, A., & Rodríguez-Pose, A. (2010). Local and regional development in time of crisis. Environment and Planning A, 42, 771-779. https://doi.org/10.1068/a43101
Vence, X. (1998). La política tecnológica comunitaria y la cohesión regional. Los retos de los sistemas de innovación periféricos. Madrid: Civitas.
Vence, X., Guntín, X., Rodil, Ó. (2000). Determinants of the uneven regional participation of firms in European Technology Programmes. The “Low R&D Trap”. European Planning Studies, 8(1), 29-42. https://doi.org/10.1080/096543100110910
World Bank (2009). World Development Report 2009: Reshaping economic geography. Washington DC: World Bank.
Abstrakt
Programy Ramowe (PR) stanowią jeden z kluczowych instrumentów po stronie podaży w zestawie polityki innowacji wdrażanych bezpośrednio przez Unię Europejską (UE). Ponieważ jej ostatecznym celem jest wspieranie innowacji i konkurencyjności, wskazane jest przeanalizowanie rozmieszczenia przestrzennego tego instrumentu w regionach UE. Głównym celem tego artykułu jest analiza regionalnej alokacji koordynacji i udziału w projektach w ramach 6-ego i 7-ego PR, a także podział środków z programu „Horyzont 2020” (8 PR). W tym celu opracowano obszerną bazę danych regionalizowaną na poziomie NUTS 2 na podstawie danych dostarczonych przez CORDIS i Platformę Inteligentnej Specjalizacji. Ponadto, w celu rozwiązania problemu relacji między programami ramowymi a rozwojem regionalnym, regiony NUTS 2 podzielono na trzy grupy: regiony słabiej rozwinięte, regiony o średnich dochodach i regiony rozwinięte. Nasze dowody empiryczne podkreślają różne trendy w tym narzędziu (zestawie) polityki innowacyjnej. Ogólna tendencja wskazuje na pozytywną korelację między poziomem rozwoju a zdolnością przyciągania projektów i funduszy. Dlatego też PR mogą przyczynić się do wzmocnienia wcześniej istniejących ośrodków innowacji i długoterminowych dysproporcji wzrostu. Tak więc koordynacja i uczestnictwo w projektach, a także środki przydzielone w ramach PR są silnie skoncentrowane w regionach rozwiniętych. Regiony o średnich dochodach przyciągają średnio więcej projektów niż mniej rozwijające się regiony, chociaż różnice między nimi nie są szczególnie wysokie. Jeśli chodzi o regiony słabiej rozwinięte, istnieją dwie różne grupy regionów. Jedna z nich charakteryzuje się znaczną liczbą koordynacji projektów, które przyciągają fundusze, nawet wyższe niż niektóre regiony o średnich dochodach; podczas gdy druga grupa wykazuje małą liczbę koordynacji lub udziału w projektach. Porównując 6-ty i 7-my PR, obserwujemy niewielkie zmniejszenie dysproporcji, w szczególności ze względu na większy udział regionów z Hiszpanii, Portugalii i Włoch, które były jednymi z najbardziej dotkniętych recesją gospodarczą w Europie. Tendencję tę można wytłumaczyć potrzebą zrekompensowania zmniejszenia funduszy regionalnych i krajowych poprzez większą aktywność w pozyskiwaniu funduszy UE.
Słowa kluczowe: Programy Ramowe, polityka innowacji, polityka spójności, rozwój regionalny, regiony słabiej rozwinięte
Biographical notes
Pedro Varela-Vázquez is a researcher and lecturer at the Department of Business Management of the University of Santiago de Compostela and a member of the ICEDE Research Group. His research focuses on wind sectoral policies, the socio-economic impact of renewable energies and their market diffusion. In this regard, he has led a research project to quantify the potential economic effects of offshore wind on the Spanish economy. Moreover, his research topics are also related to public procurement for innovation, as well as innovation policies in peripheral areas.
Manuel González-López is a researcher and Associate Professor at the Department of Applied Economics of the University of Santiago de Compostela and a member of the ICEDE Research Group. He has published many papers in national and international journals in the field of regional development and innovation with a particular focus on the EU regions. He has also participated in several national and EU projects about innovation policies, regional innovation systems and other similar topics. His academic and research activity shows a high international profile as he completed his post-graduate studies in the UK, participated as a visitor researcher in France and Denmark and has collaborated in a large number of international (EU) projects.
María del Carmen Sánchez-Carreira is a researcher and Assistant Professor at the Department of Applied Economics, University of Santiago de Compostela and a member of the ICEDE Research Group. Her main research topics are state-owned enterprises, privatization, innovation policies and public procurement. Apart from academic publications, she has participated in several international and national projects.
Table 5. Summary statistics of coordination and participation in projects per million of inhabitants regarding the regional economic development
|
Sum |
Cfp6/POP |
Pfp6/POP |
Cfp7/POP |
Pfp7/POP |
|||||||||||||||||
|
Mean |
Std. Dev. |
Min. |
Max. |
Sum |
Mean |
Std. Dev. |
Min. |
Max. |
Sum |
Mean |
Std. Dev. |
Min. |
Max. |
Sum |
Mean |
Std. Dev. |
Min. |
Max. |
|||
|
2000 |
LDR |
503 |
7 |
13 |
0 |
64 |
3,491 |
45 |
66 |
0 |
344 |
1,376 |
18 |
49 |
0 |
294 |
5,760 |
75 |
141 |
0 |
787 |
|
MIR |
687 |
10 |
16 |
0 |
117 |
3,989 |
59 |
76 |
0 |
473 |
1,377 |
20 |
32 |
0 |
208 |
5,453 |
80 |
102 |
0 |
553 |
|
|
DR |
3,183 |
24 |
26 |
0 |
187 |
18,572 |
142 |
142 |
0 |
1,040 |
6,186 |
47 |
46 |
0 |
208 |
23,534 |
180 |
179 |
4 |
1,393 |
|
|
2009 |
LDR |
458 |
6 |
12 |
0 |
64 |
3,026 |
41 |
63 |
0 |
344 |
1,201 |
16 |
44 |
0 |
294 |
4,893 |
66 |
128 |
0 |
787 |
|
MIR |
919 |
10 |
17 |
0 |
117 |
4,591 |
52 |
52 |
0 |
289 |
1,935 |
22 |
40 |
0 |
227 |
6,456 |
73 |
96 |
0 |
619 |
|
|
DR |
2,996 |
27 |
26 |
0 |
187 |
18,434 |
163 |
149 |
0 |
1,040 |
5,802 |
51 |
45 |
0 |
208 |
23,398 |
207 |
185 |
10 |
1,393 |
|
|
2015 |
LDR |
673 |
8 |
18 |
0 |
117 |
3,654 |
44 |
68 |
0 |
344 |
1,813 |
22 |
53 |
0 |
294 |
6,473 |
77 |
147 |
0 |
787 |
|
MIR |
835 |
9 |
12 |
0 |
81 |
5,128 |
58 |
65 |
0 |
473 |
1,574 |
18 |
25 |
0 |
176 |
6,254 |
71 |
76 |
0 |
553 |
|
|
DR |
2,866 |
28 |
27 |
0 |
187 |
17,269 |
166 |
149 |
0 |
1,040 |
5,552 |
53 |
46 |
0 |
208 |
22,020 |
212 |
187 |
10 |
1,393 |
|
Source: own elaboration based on CORDIS.
Table 6. Summary statistics of the total coordination and participation in projects per million of inhabitants regarding the regional economic development
|
Sum |
Cfp6_7/POP |
Pfp6_7/POP |
|||||||||
|
Mean |
Std. Dev. |
Min. |
Max. |
Sum |
Mean |
Std. Dev. |
Min. |
Max. |
|||
|
2000 |
LDR |
1,879 |
24 |
62 |
0 |
358 |
9,250 |
120 |
202 |
0 |
1,037 |
|
MIR |
2,064 |
30 |
47 |
0 |
324 |
9,442 |
139 |
175 |
0 |
1,026 |
|
|
DR |
9,369 |
72 |
70 |
0 |
395 |
42,106 |
321 |
319 |
17 |
1,273 |
|
|
2009 |
LDR |
1,660 |
22 |
56 |
0 |
358 |
7,919 |
107 |
186 |
0 |
1,037 |
|
MIR |
2,854 |
32 |
56 |
0 |
324 |
11,047 |
124 |
143 |
0 |
835 |
|
|
DR |
8,798 |
78 |
69 |
0 |
395 |
41,832 |
370 |
331 |
17 |
2,415 |
|
|
2015 |
LDR |
2,486 |
30 |
69 |
0 |
358 |
10,127 |
121 |
210 |
0 |
1,037 |
|
MIR |
2,409 |
27 |
37 |
0 |
257 |
11,382 |
129 |
138 |
0 |
1,026 |
|
|
DR |
8,418 |
81 |
71 |
0 |
395 |
39,289 |
378 |
333 |
17 |
2,432 |
|