


Waidi Adeniyi Akingbade, Department of Business Administration, Lagos State University, Ojo; Lagos, Nigeria. P.O. BOX 10149, LASU, Post Office, Ojo, Lagos State, Nigeria, tel.: +234-80-3050-0622, e-mail: This email address is being protected from spambots. You need JavaScript enabled to view it..
Abstract
The influence of globalization in telecommunication companies has greatly increased the level of competition in the industry and they are forced to be competitive to survive. Different types of strategies are put in place in order to be profitable and competitive. All these strategies are directed to attract, retain and maintain customers for continuous profitability. However, majority of them hardly measure the impact of their strategic innovation on their customers. The paper seeks to explore the influence of competitive strategies embarked upon by selected telecommunication companies in Nigeria on their performance. The paper also examines how competitive strategies could be implemented for improved customer satisfaction, retention and loyalty. Three null hypotheses were postulated to test the relationship between lower prices and customer satisfaction, uninterrupted trunk services and customer loyalty, and customer complaint handling and retention. Only customers using telephone service were selected as respondents from Lagos State. The state was stratified in to 20 local government council area and questionnaires were distributed to 125 respondents in each of them. The completion rate of the questionnaire in each of them is between 103 and 110. Survey research design was adopted to carry out the study. A structured questionnaire was designed and validated through the construct validity and tested for confirmation using the KMO measure of sampling adequacy. It was also made reliable using Cronbach’s Alpha test. From the study, findings revealed relationship between competitive strategies and customer satisfaction, retention and loyalty. The findings revealed that there is a relationship between competitive strategies, its constituents and performance of telecommunication companies. It is recommended that universal mobile telecommunication services (UMTS) operators should adopt the culture of competitive strate.
Keywords: competitive strategy, performance, lower pricing, customer satisfaction.
INTRODUCTION
In recent years, there have been a great increase in the level of competition in virtually all areas of business and that of telecommunication is not an exception. The ability to outperform competitors and to achieve above average profits lies in the pursuit and execution of an appropriate business strategy (Yoo, Lemak & Choi, 2006). These have resulted in greater attention to analyzing competitive strategies under different environmental conditions. Porter (1985) states the three generic strategies that are required for different resources, organizational arrangements, control procedures, styles of leadership, and incentive systems could translate to improved organizational performance and competitive advantages. The three generic competitive strategies are overall price leadership, differentiation and focus i.e. cost or differentiation in a narrow market segment (Porter, 1985).
The highly competitive market in the telecommunication industry is now making UMTS companies operators to utilize competitive strategies that will make them grasp surprising opportunities, respond to threats and outmanoeuvre their rivals in order to endure and succeed.
Strategy is the direction and scope of an organization over the longterm that provides advantages for the organization through its pattern of resources within a demanding environment. Strategies exist at several levels in organizations, ranging from the overall business to individuals working. However, the levels of strategies are divided into three broad categories, namely corporate, business and functional levels (Oyedijo,2013; Thompson & Strickland, 2010).
Telecommunication industry in Nigeria in the last ten years has recorded unprecedented growth and development. There was a tremendous improvement in the qualities and quantities in different types of services provided to customers. The deregulation of the industry led to the increase in the number of providers of the telecommunication services and of the numbers of subscribers or customers. These led to competition between the providers as each of them pursues strategies that are directed to enable them to have their own share of the market in order to be profitable and to survive. The extents to which the uses of different competitive strategies by the selected telecommunication companies have led to improved performance and to what extent customers have responded to the provider’s strategies have not being sufficiently examined. It is necessary to find out the extent to which competitive strategy could lead to improved performance, customer satisfaction, loyalty and retention in the telecommunication industry.
The link between competitive strategies and organizational performance is a key issue in the field of strategic management. The competitive strategy performance relationship has been a prevalent research topic over the pasts three decades. This paper is an attempt in this direction to examine the extent to which competitive strategies could influence performance in the Nigeria telecommunication industry. It also seeks to find out the relationship between the application of each of the strategies to contribute to and improve performance in Nigeria telecommunication industry
LITERATURE REVIEW
The field of strategic management presents various typologies to describe the generic competitive strategies of firms, how firms compete in specific businesses or companies by exporting their competitive advantage in order to realise their goals (e.g. Hambrick, 1983, Porter, 1980 Miles & Snow, 1978). The typologies all focus on a firm’s relative emphasis on operational efficiency and low cost or uniqueness in the market. This paper however focuses on Miller (1992) High Performance Gestalt and Porter’s (1980) typology of generic competitive strategies which is made up of overall price leadership, differentiation and focuses (cost or differentiation in anarrow market segment) and hybrid for the following reasons. First, Porters typology overlaps with other competitive strategy typologies. For instance, Porters strategy of cost leadership is synonymous with Miles and Snow’s (1978) defender strategy and Hambrick’s (1983) efficiency strategy. Porter’s differentiation strategy also resembles Miles and Snow’s prospector strategy.
Second, Porter’s typology has been linked to many organizational, environmental and performance – related variables (Campbell–Hunt, 2000; Dess & Davis, 1984; Kotha & Vadlamam, 1995; Ward & Druay, 2000). Porter’s framework proposes that firms that pursue any of these competitive strategies would develop a competitive advantage that would enable them to outperform competitors in their industry. However, for a firm to earn superior profits and outperform its competitors, it must make a clear choice between a cost leadership and differentiation strategy in order to avoid “the inherent contradictions of different strategies” (Porter, 1996).
This study emphasizes price leadership, differentiation and focus strategies, because they are the commonly used strategy dimensions in the literature (Dess & David, 1984; Nayyar, 1993; Allen & Helms, 2006). A differentiation strategy in Nigeria telecommunication companies may be based on simultaneously creating customer loyalty by generating differences in product image through intensive marketing and image management (Miller, 1988), creating products that are innovative, dependable, durable and serviceable (Beal & Yasai-Ardeka 2000). Dess and Davis (1984) and Beal (2000) further develop the differentiation strategy of Porter. Beal distinguishes four different differentiation strategies i.e innovation differentiation, service differentiation, marketing differentiation and quality differentiation. The cost leadership strategy represents attempts by firms to generate competitive advantage by achieving the lowest cost in the industry (Amoako – Gyanpah & Acqyaah, 2008). The focus of firms implementing a cost leadership strategy is on stringent cost controls and efficiency in all areas of operation (Porter, 1980). Either of these two approaches can be accompanied by a focus of organizational efforts on a given segment of the market (Gibcus & Kemp, 2003). From a theoretical point of view, the arguments for the adoption of hybrid strategies stem from some problems associated with pure strategies (Miller, 1992). Thus, hybrid strategies may address customer needs better; they may be more difficult to imitate; and they may generate a more flexible wider view.
Meanwhile, Porter (1980) suggested that a business attempting to combine the two approaches invariably ends up stuck in the middle. He argued that the low cost and differentiation strategies are based on incompatible assumptions and thereby create trade – off within the organization. This notion received considerable initial support (Dess & Davis, 1984, Hambrick, 1981; Hoawes & Crittendon, 1984); it was later challenged by a substantial body of research (Oyedijo, 2012; Parnell, 1997; Parnell & Wright, 1993; Proff, 2000). Members of the “combination strategy school” have argued that business successfully combining low costs and differentiation may create synergies within the firm that overcome any trade – offs that may be associated with the combination.
The sustainability of the three generic strategies demands that a firm’s competitive advantage resist erosion by competitor behaviour or growth. The sustainability of a generic strategy requires that a firm possesses some barriers that make imitation of the strategy difficult. It is usually necessary for a firm to offer a moving target to its competitors by investing in order to continually improve its position. Each generic strategy is also a potential threat to the others (Gibcus & Kemp, 2003). Gibcus and Kemp (2003) argued that firms with a clear and consistent strategy will outperform firms without such a strategy. This is the main argument for porter to define his generic strategies.
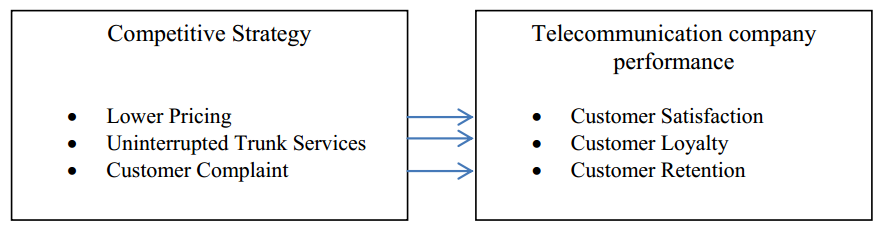
Meanwhile the model presented in Figure 1 suggests that company performance (customer satisfaction, customer loyalty, customer retention) is directly affected by competitive strategy (lower price, uninterrupted trunk services and customer complaint).
Telecommunication companies operations and performance in nigeri
The development of telecommunication facilities in Nigeria began in 1886 when a cable connection was established between Lagos and London by the Colonial administration (Adegboyega, 2008). From the very beginning it was clear that the introduction of telephone services in the country was not induced by economic or commercial motives. Furthermore, it was not meant to enhance economic growth; it was originally developed as a tool for colonial subjugation.
Salawu (2008) stated that between independence in 1960 and 1985, telecommunication service became commercialized. He stressed further that the old department of post and telecommunication (P&T) under the Ministry of communication Limited (N.E.T) was created to take care of external telecommunication services while the old P & T handled internal network. By January 1985, the erstwhile (P&T) divisions merged with N.E.T to form Nigeria telecommunication limited (NITEL) a government owned Limited Liability Company. The objective of establishing NITEL was to harmonize the planning and coordination of the internal and external communication service, rationalize investments in telecommunication development and provide accessible, efficient and affordably services.
NITEL, the only national monopoly operator in the sector, was synonymous with epileptic service and bad management which made telephone then to be unreliable, congested, expensive and customer unfriendly. According to Ajayi, et al (2008) the years 1992 to 1999 were tagged as the partial liberalization era, when government embarked on market – orientated, partially liberalizing the Nigeria telecommunication sector via NCC Decree 75 of 1992. The reforms include separation of the policy – making body from industry regulator and networks operators/ service providers and licensing of network operator/ service providers which began in 1996.
Performance is an essential concept in management research. Managers are judged on their firm’s performance. Good performance influenced the continuation of the firm (Gibcus & Kemp, 2003). Much of the research on performance measurement has come from organization theory and strategic management (Murphy et al, 1996). For instance, Porter (1980) defines good performance as the above average rate of return sustained over a period of years.
Venkatranan and Ramanjam (1996) pointed out that firm performance is a multidimensional construct. Financial performance includes return on assets (ROA), return on sales (ROS), and return on equity (ROE). They measure financial success and tap current profitability (Parker, 2000; Man, 2009). Business performance measures market – related items such as market share, sales growth diversification, and new product development (Gray, 1997; Amoako – Gyampah & Acquaah, 2008; Man, 2009). Organizational effectiveness measures are closely related to stakeholders than shareholders like employee satisfaction, quality and social responsibility (Gibcus & Kemp, 2003; Man, 2009).
The Nigeria telecommunication sector witnessed a major revolution in 2001 with the granting of the global system for mobile telecommunication (GSM) license to providers. The current role calls of GSM operators consists of MTN, Airtel, Glomobile, Etisalat, Visafone, Nitel’s M-tel, Multi-Links, Starcoms among others. The country’s telecommunication industry was the largest contributor to growth in 2012, expanding by 34.2 percent. Telecoms as a percentage of GDP was 7.05 percent in 2012, higher than financial services and manufacturing sectors (Business Day, 2013) The environment is therefore becoming more competitive than before while some of the telecommunication companies have started expanding their operators overseas to compete with long established providers in international market.
RESEARCH METHODS
Out of 30 telecommunication companies in Nigeria only the four (4) major ones were selected for the study. This is because these 4 are the ones providing UMTS and LTS to about 98 per cent phone users in Nigeria, while the remaining 25 telecommunication companies are providing fixed lines services to less than 2 per cent of Nigerians that are using it. All the four were considered on individual bases to assess their customer loyalty, retention, and satisfaction. This is because all of them although using various strategic approaches that are not easily discernible, are all directed to make their services competitive to attract more customers and to be profitable.
The survey (descriptive) research design was chosen mainly because it comprises cross-sectional design in relation to which data are collected predominantly by questionnaire. The study was conducted in Lagos State, the most densely populated city in West Africa, former Nigeria capital, a megacity and presently industrial and commercial capital of the country where most of the phone users resides. Lagos was therefore considered a good representation of phone users in Nigeria. Hence the population sample was taken from Lagos State, Nigeria. The target population consisted of all UMTS phone users in Lagos State.
2500 questionnaires were simply randomly distributed to mobile phone users. 2123 were returned and found usable for the study. Data were analysed using correlation coefficient and regression analysis.
The instrument used for collecting primary data in the study was a questionnaire and was mainly designed to elicit information from phone users of selected telecommunication companies. The questionnaire was developed to determine the extent to which customers responded to competitive strategies of selected telecommunication companies. Most of the items used to measure competitive strategy and performance came from the instruments developed by (Porter, 1980; Ramanujuam, et al, 1987). Competitive strategy was measured by examining; lower pricing, uninterrupted trunk services and customer complaint handling strategy.
Performance was measured objectively by looking at customer satisfaction, customer loyalty and customer retention. These performance employed objective measures developed by (Gray, 1997; Venkatraman and Ramanujam, 1996). This instrument has been widely used in prior research (see for example, Asikhia, 2006; Khan, 2008; Tepeci & Eliwa, 2006, Bisby and Otley, 2004; Hoque, 2004).
A sample size of 2500 from the phone users was used for the study. Simple random sampling method was adopted in selecting respondents from the population of study and this helped to ensure that each customer has an equal chance of being selected. It was observed that all the four major telecommunications companies use the same strategies, but the success of the strategies is different. The following numbers of respondents were selected from respective telecommunication companies; MTN 860, Airtel 715, Globalcom 565 and Etisalat 360. There were 2123 usable completely filled questionnaires received from the sample size of phone users or a favourable response rate of 85%, while the remaining 377 questionnaire were rejected due to incompleteness. Linear correlation analysis and simple regression analysis were used to test for the significance, degree and extent of relationship between the variables of competitive strategy and performance.
DATA ANALYSIS AND INTERPRETATION
In order to test for the robustness of the variables used in the study, a test of reliability and validity of the variables in the study was carried out using Cronbach’s alpha and KMO measure of sampling adequacy (see appendix). Previous description on the various constructs and their use in several past research studies provide evidence of the validity of the scales (Khan, 2008). The items used were adopted from previous studies and did not represent new scales. The reliability coefficients (Cronbach alpha) gave a value 0.971 which according to Hair et al (2006), the instrument of value of 0.7 and above is reliable. Hence, the instrument is reliable. KMO measure of sampling adequacy gave a value of 0.870; hence the degree of variations between the construct variables is very low and therefore confirms its validity for the current study.
From the analysis of the collected data R represents the coefficient of correlation to test for degree of relationship; R2 represents the coefficient of determination to test for the extent to which two variables are correlated, Sig. value in the ANOVA table represents the significance of the relationship between two variables while the coefficient table represents the model establishing the relationship between the variables and their significances in the model. The results were thereafter buttressed by previous findings of scholars in the related field to justify the results of this study.
| Model | R | R square | Adjusted R Square | Std. Error of the Estimate | Durbin-Watson |
|---|---|---|---|---|---|
| 1 | .983a | .966 | .951 | .487 | .038 |
| a. Predictors: (Constant), Lower Price b. Dependent Variable: Customers Satisfaction |
|||||
To test the first hypothesis, simple regression analysis was used to regress the independent variable against dependent variable. Table 1 above indicates the model summary of the simple regression equation that predicted customer’s satisfaction. The explanation of the results presented in the Table 2 is given below.
tr>BStd. ErrorBeta
| Model | Unstandardized | Coefficients | Standardized Coefficients | t | Sig. | |
|---|---|---|---|---|---|---|
| 1 | (Constant) | -1.672 | .060 | -28.010 | .000 | |
| Lower Price | .665 | .003 | .983 | 244.452 | .000 | |
| a. Dependent Variable: Customers Satisfaction. | ||||||
| Model | Sum of Squares | df | Mean Square | F | Sig. | |
|---|---|---|---|---|---|---|
| Regression | 14197.377 | 1 | 14197.377 | 59756.625 | .000b | |
| Residual | 503.921 | 2121 | .238 | |||
| Total | 14701.298 | 2122 | ||||
| a. Dependent Variable: Customers Satisfaction. b. Predictors: (Constant), Lower Price. |
||||||
The model summary table (Table 1) provides useful information about the regression analysis for the first hypothesis. First, the ‘simple r’ column is the correlation between the actually observed independent variable and the predicted dependent variable (i.e., predicted by the regression equation). ‘r2’ is the square of r and is also known as the ‘coefficient of determination’. It states the proportion (percentage) of the (sample) variation in the dependent variable that can be attributed to the independent variable(s). The correlation coefficient (r) value of 0.983 indicates the existence of strong positive relationship between lower pricing and customers satisfaction. The co-efficient of determination (r2) value of 0.966 explains the proportion of variation in customers satisfaction that are attributed variations in price (i.e. lower prices). The value of 0.966 shows that lower prices is a good predictor of customers’ satisfaction. The r2 often overstate the true value of explanations due to the unadjusted degrees of freedom and to eliminate such, the adjusted r2 value of 0.951 shows the actual variation in the customers’ satisfaction attributed to lower prices. The ‘standard error of estimate’ indicates that, on average, observed customers satisfaction deviate from the predicted regression line by a score of 0.487. The value of the intercept (ß 0) indicates that the value of customers’ satisfaction when all the explanatory variable are zero is -1.672. Specifically, one percent reduction in price of calls increases the level of customers’ satisfaction 66.5 percent. Hence, lower price is statistically significant in explaining changes in customers level of satisfaction at the 5 percent level of significance. The t-test statistic (in Table 3) indicates the individual significance of the parameters used in the model. Each value is compared with the table value (ttab at 5% = 1.70) and they all exert a significant influence in the function of the model. The F-ratio value of 59756.625 (Table 3) compared with the table value of 3.01 shows the overall significance of the model as well as the goodness of fit through its explanatory power. This shows that the model is significant because the calculated F-ratio of 59756.625 is greater than the table value of 3.01 5 percent level of significance. To this end, hypothesis one which stated that lower pricing do not influence customers satisfaction was rejected and it was revealed that lower pricing influenced customers satisfaction.
But NCC survey for 2012 below could not link customer satisfaction to the number of customers of each of the network. The number of customers for MTN is higher than that of other network but their customer satisfaction index is lower. However, we can still trace increasing customers of other network to their customer satisfaction most especially Etisalat, Globalcom and Airtel (See Figure 2). Price is being used by these three networks as a form of competitive strategy from 2012 to date.
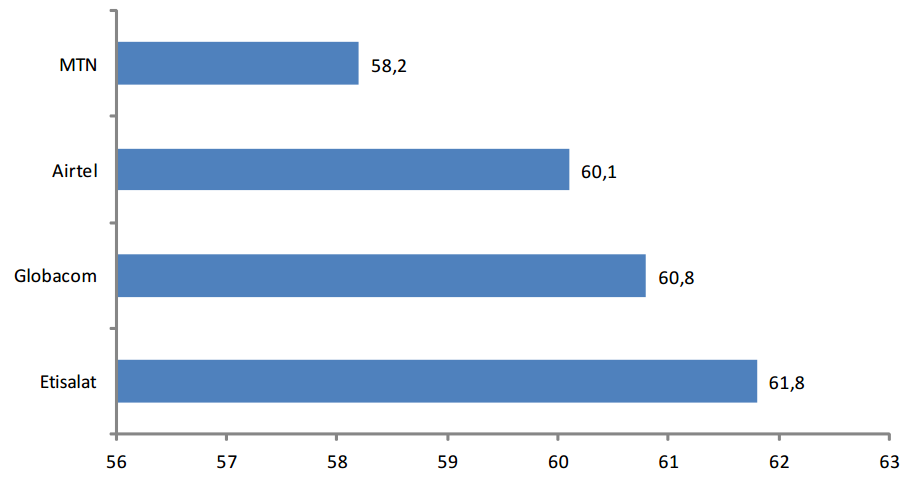
Source: NCC (2012).
In order to measure the level of customer satisfaction of mobile users of the four major service providers based on the Figure 2, NCC (2012) used the following parameter:
- Mobile users were generally positive about the quality of the calls.
- The quality of off-net calls was poorer than the quality of on-net calls, and the quality of calls to fixed line networks was even poorer.
- Getting cut off during a call is regarded as the most common network reliability issue - 51% said they were sometimes cut off, while 11% said it happened often.
- 65% of respondents reported having to dial twice or more to get through
- 25% reported having to dial more than three times.
- 94% of mobile users use SMS
- Unsolicited SMS messages (spam) are a problem - Only 23% of respondents said they never or rarely received unsolicited messages.
- Problems of spam and being unable to send an SMS were felt most acutely in the South South Zone, where 46% of respondents said they often received unsolicited SMS, compared to 24% for the whole sample.
- 19% of those in the South South said they were often unable to send an SMS, compared to 11% for the whole sample.
- 28% of mobile users use their phone to access information and Value Added Services (VAS), but 88% of VAS users encountered some difficulties accessing the services.
On the issue of charging, Globacom and Etisalat registered higher scores; Etisalat had the highest scores for the correct charging of calls 65.5, closely followed by Globacom with 65.2. On the issue of whether rates aligned with service providers’ advertised rates, Etisalat scored highest with 60.9, closely followed by Globacom on 59.1. MTN was the lowest on both issues of charging; it scored 60.4 for the correctness of charging and 55.3 for the whether the rates it charged agreed with advertised.
Hypothesis 2: Uninterrupted and Quality Trunk services do not influence customer loyalty.
| Model | R | R square | Adjusted R Square | Std. Error of the Estimate | Durbin-Watson |
|---|---|---|---|---|---|
| 1 | .714a | .510 | .509 | .535 | .010 |
| a. Predictors: (Constant), Uninterrupted and Quality Trunk Services. b. Dependent Variable: Customer Loyalty. |
|||||
To test the hypothesis two, simple regression analysis was also used to regress the independent variable against dependent variable to make our prediction. Table 4 above indicates the model summary of the simple regression equation that predicted customer loyalty. The explanation of the value is presented below.
tr>BStd. ErrorBeta
| Model | Unstandardized | Coefficients | Standardized Coefficients | t | Sig. | |
|---|---|---|---|---|---|---|
| 1 | (Constant) | 3.229 | .032 | 99.692 | .000 | |
| Network Coverage | .083 | .002 | .714 | 46.959 | .000 | |
| a. Dependent Variable: Customer Loyalty. | ||||||
| Model | Sum of Squares | df | Mean Square | F | Sig. | |
|---|---|---|---|---|---|---|
| Regression | 631.683 | 1 | 631.683 | 2205.125 | .000b | |
| Residual | 607.584 | 2121 | .286 | |||
| Total | 1239.267 | 2122 | ||||
| a. Dependent Variable: Customer Loyalty. b. Predictors: (Constant), Uninterrupted and Quality Trunk services. |
||||||
The values presented in tables above, summarise and test the second hypothesis of this study. The Table 4 above shows that Uninterrupted and Quality Trunk services (the explanatory variable) influence customers loyalty to the sampled telecommunication companies. The correlation coefficient (r) value of 0.714 reveals the existence of strong positive correlation between Uninterrupted and Quality Trunk services and customers loyalty. The coefficient of determination (r2) value of 0.510 gives the proportion of variation in customer’s loyalty that is attributed to wider Uninterrupted and Quality Trunk services. The value of 0.510 indicates that wider Uninterrupted and Quality Trunk services are a better predictor of customer’s loyalty. The r2 often overstate the true value of explanations due to the unadjusted degrees of freedom and to eliminate such, the adjusted r2 value of 0.509 provides the actual variation in the customers loyalty attributed to Uninterrupted and Quality Trunk services. The ‘standard error of estimate’ indicates that, on average, observed customers loyalty deviates from the predicted regression line by a score of 0.535. This implies that an Uninterrupted and Quality Trunk service has a positive impact on customer’s loyalty and that both variables, move in the same direction.
Further analysis on the result above and to make comparisons with findings of previous studies, we discuss the explanatory powers of the Uninterrupted and Quality Trunk services on the explained variables in turn, at a significant level of 5%. The value of the intercept (ß 0) indicates that the value of customer’s loyalty when all the explanatory variable are zero is 3.229. The estimated parameter for network coverage is 0.083 and the p–value is 0.000, which is less than 0.05, and this indicates that we are 100% certain that the effect of Uninterrupted and Quality Trunk services on customer’s loyalty as seen in the results is true. In other words, a variation in customer’s loyalty to the Telecommunication companies is explained by Uninterrupted and Quality Trunk services. This result suggests that customer’s loyalty increases as network coverage increases. The t-test statistic (in Table 5) indicates the individual significance of the parameters of the model. Each value is compared with the table value (t tab at 5% = 1.70) and they all exert a significant influence in the function of the model. The F-ratio value of 2205.125 (Table 6) compared with the table value of 3.01 shows the overall significance of the model as well as the goodness of fit through its explanatory power. The value indicates that the model is significant because the calculated F-ratio of 2205.125 is greater than the table value of 3.01 5 per cent level of significance. Therefore, hypothesis two which stated that Uninterrupted and Quality Trunk services do not influence customer loyalty was rejected and it was revealed that Uninterrupted and Quality Trunk services influenced customer loyalty.
The NCC (2012) states the major indicators for determining quality call of each of the four major mobile telephone operators. It indicates that the differences between Nigeria’s four major mobile operators were modest across all indicators for mobile telephony. MTN registered lower scores on quality of calls to other mobile and fixed networks; it scored 58.5, compared to Etisalat’s score of 63.1, which was the highest for that indicator. Etisalat also scored highest on issues concerning network reliability, but differences were modest again. For example, Etisalat scored 62.8 on the loss of service indicator, the lowest score of 60.9 was registered by MTN, closely followed by Airtel’s score of 61.
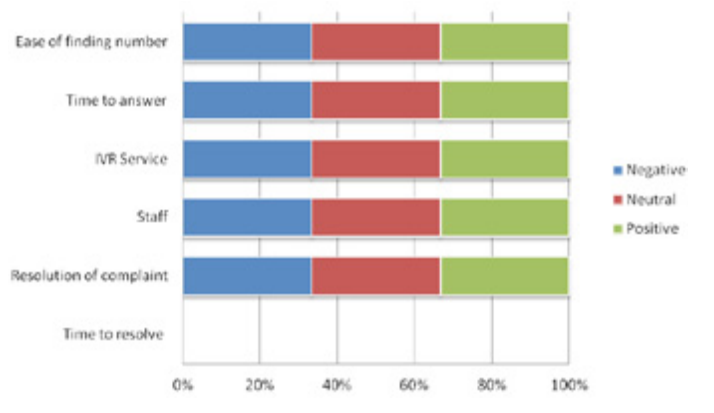
Although the differences were modest, Etisalat subscribers rated VAS services highly (57.2), and MTN subscribers rated those relatively poorly (55.5). Etisalat subscribers rated all aspects of complaints handling highly. It received the highest scores for all complaints handling indicators, apart from the effectiveness of the IVR service; its score of 63.2 was just beaten by Airtel’s score of 63.3.
When looking at differences between zones, mobile services appeared to be better in the North Central & FCT and South West zones. Views on the charging for SMS and VAS services were poorer in North West zone, and respondents in South South zone appeared to have greater technical difficulty in using these services (NCC, 2012). Respondents in these two zones also rated mobile recharge services poorly. Note that views on complaints handling procedures appeared to mirror views on service provision, so respondents from the North West and South South zones rated complaints handling process highly.
These indices determine the level of customer’s patronage and therefore the competitive strategy of each of the providers. NCC (2012), market survey shows that in terms of subscriber numbers, MTN was the clear market leader followed by Airtel and Globacom. 63% used MTN as their principle phone; 13.9% used Airtel; 13.3% used Globacom and 8.1% used Etisalat (Figure 3). This shows that MTN has the highest sales growth among the telecommunication companies operating in Nigeria, which is also in line with their volume of profitability. Nigeria, Africa’s largest mobile phone market by subscribers, continues to expand albeit at a slower level than before as the industry high growth rate slows. Recent data from NCC (2013) shows that the number of active telecoms lines grew by 16percent year-on-year in June 2013 to 120.36 million.
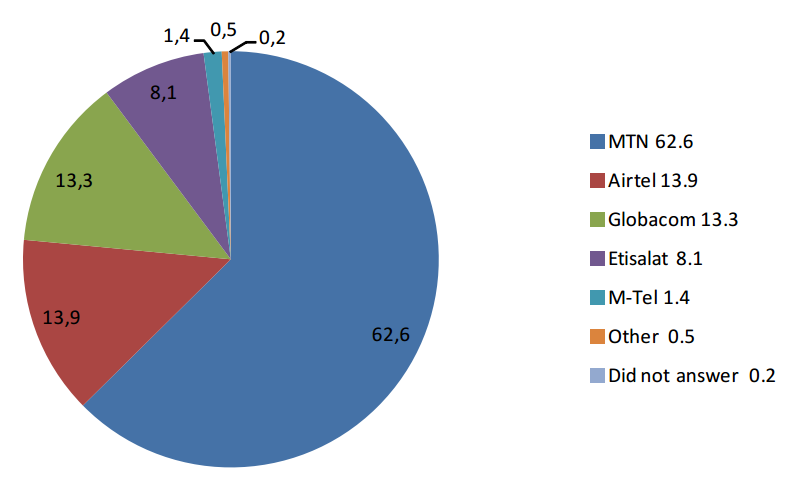
Source: NCC (2012).
The Nigeria consumer satisfaction survey carried out by NCC (2012) shows that in Nigeria telecommunication industry MTN and Econet (now Airtel) were the first licensed operators to provide services in Nigeria in August 2001. Today, MTN is the apparent market share leader in Nigeria, with more than twice the number of subscriptions as its nearest rivals, Globalcom and Airtel. The market share of some GSM operators are as follows: MTN 40.40%; Globalcom 21.59%; Airtel 19.46%; Etisalat 12.83%; CDMA 3.84%; MTEL Limited 0.25% (See Figure 3). Furthermore, MTN Group’s Nigerian unit is the market leader in Nigeria with 55.23 million customers, followed by Nigeria’s Globacom with 25.0 million, New Delhi based Bharti Airtel with 21.59 million, and Abu Dhabi-based Emirates Telecommunications Corp,’ Etisalat with 15.3 million (NCC website, 2013).
Hypothesis 3: Customer Complaints Handling do not influence customer retention.
| Model | R | R square | Adjusted R Square | Std. Error of the Estimate | Durbin-Watson |
|---|---|---|---|---|---|
| 1 | ..978a | .956 | .955 | .313 | .038 |
| a. Predictors: (Constant), Customer Complaints Handling. b. Dependent Variable: Customer Retention. |
|||||
tr>BStd. ErrorBeta
| Model | Unstandardized | Coefficients | Standardized Coefficients | t | Sig. | |
|---|---|---|---|---|---|---|
| 1 | (Constant) | 2.716 | .029 | 95.097 | .000 | |
| Quality Service | .239 | .001 | .978 | 214.333 | .000 | |
| a. Dependent Variable: Customer Retention. | ||||||
| Model | Sum of Squares | df | Mean Square | F | Sig. | |
|---|---|---|---|---|---|---|
| Regression | 4494.988 | 1 | 4494.988 | 4494.988 | .000b | |
| Residual | 207.535 | 2121 | .098 | |||
| Total | 4702.523 | 2122 | ||||
| a. Dependent Variable: Customer Retention. b. Predictors: (Constant), Quality Service. |
||||||
The results of the regression analysis of the relationship between customer complaints handling and customer retention to test hypothesis three is presented. The findings in Table 7, shows a significant positive relationship between customer complaints handling and customer retention at r= .978. The co-efficient of determination (r2) for the regression is 0.956 and the r-square adjusted for degrees of freedom for the regression is 0.955. In this study, 95.6 percent of the variability in customer retention can be explained by advancement of customer complaints handling. The remaining 4.4 percent of variability is due to other unexpected factors. This implies that customers are retained to a particular network as a result of customer complaints handling service provided. The ‘standard error of estimate’ indicates that, on average, observed customers retention deviate from the predicted regression line by a score of 0.313. Hence, we deduce that there is a significant relationship between customer complaints handling and customer retention in the Nigerian telecommunication industry.
To further analyze the result above and to make comparisons with findings of previous studies, we discuss the explanatory powers of the customer complaints handling on the explained variable in turn, at a significant level of 5%. The value of the intercept (ß 0) indicates that the value of customer retention when the explanatory variable is zero is 2.716. The estimated coefficients for quality service is 0.239 and the p–value is 0.000, which is less than 0.05, and this indicates that we are 100% certain that the effect of customer complaints handling on customer retention as seen in the results is true. This therefore suggests that the behaviour of the explainer variable could not have occurred by chance. This suggests that customer complaints’ handling has a positive influence on customer retention. That is an increase in the form of customers cares service, voice clarity, stable and fast data service etc, results in an increase in the customer retention to a network. In addition, the t-test statistic (in Table 8) indicates the individual significance of the parameters used in the model. Each value is compared with the table value (t tab at 5% = 1.70) and they all exert a significant influence in the function of the model. The F-statistics and its probability shows that the regression equation is well formulated explaining that the relationship between the variables combined to performance are statistically significant (F-ratio = 45938.575; F-pro. = 0.000). Therefore, this further supported the results of strong positive relationship between customer complaints handling and customer retention. Hence, hypothesis three which stated that customer complaints handling do not influence customer retention was rejected and it was concluded that customer complaints handling influenced customer retention.
NCC (2012) survey reveals that 32% of respondents had made a complaint in the year. 90% of these usually lodged complaints by phone, while only 8% said they visited a customer care centre (Figure 5). Figure 4 shows that most complaints concerned charging, billing, and the recharging of pre-paid accounts.
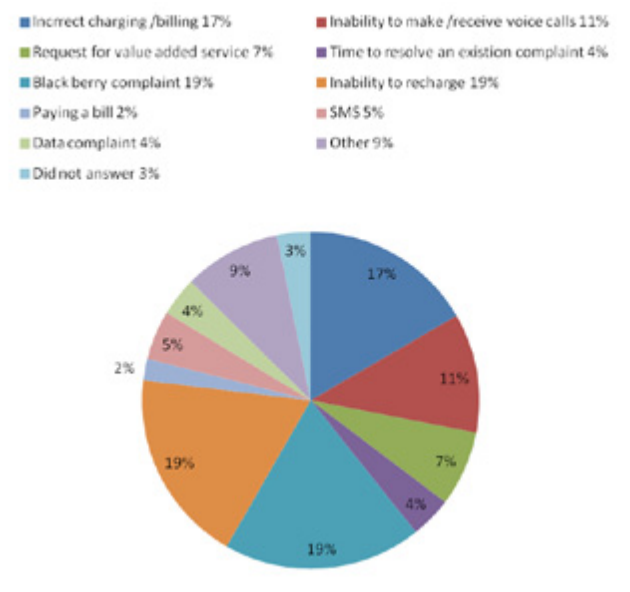
source: NCC (2013)
source: NCC (2013)
CONCLUSIONS AND RECOMMENDATIONS
The study focused on the analysis of competitive strategies and improved performance in selected Nigeria telecommunication companies. The study establishes the importance of each of the competitive strategies on the crucial factors affecting the telecommunication performance indices despite local and global challenges facing the industrial business environment.
Since their establishment, the four major telecommunication companies had made significant profit from their investment. But despite all the efforts made through the provision of competitive strategies to improve customer satisfaction, retention and loyalty, the customers have not sufficiently enjoyed improved services. Most of them still rendered epileptic services to their customers in spite of their huge amount of charges. Their poor services ranges from call blockage, bad system coverage, poor voice quality, network failure, dropped call rate all at the expense of their customers. Telecommunication companies embarked on a series of competitions among themselves in order to make abnormal profit. Problems of trunk failure, poor services, incorrect charging/ billing among others have made it difficult for the customers to enjoy better services.
The study recommends that telecommunication companies should tailor their strategies towards customer satisfaction and improvement in the quality of their services for sustainable profit and competitiveness.
This study provides a useful basis upon which further studies in the industry could be conducted. There is a need to undertake similar studies in other sectors to ascertain how different sectors deal with the competitive strategies to achieve sustained performance. The study also contributes to the existing literature in the area of strategies that academicians could use as a basis of further research.
Despite all the aforementioned problems there has been tremendous improvement in the performance of telecommunication industry in Nigeria.
References
- Adegboyega, O.A. (2008). Seven years of telecoms revolution-Hello! This is how it all began. Tell Magazine.
- Allen, R.S., & Helms, M .M. (2006). Linking strategic practices and organizational performance to Porter’s generic strategies. Business Process Management Journal, 12(6), 102-120. Aluga, F. (2010). Influence of new product development on organizational performance: A case of Safaricom phone service provider in Kisumu, Kenya. Unpublished MSc thesis, University of Nairobi.
- Amosko-Gyampah, K., & Acquaah, M. (2008). Manufacturing Strategies, Competitive strategies and firm performance: An empirical study in a developing economy environment. International Journal of Production Economics, 4(III), 1-12.
- Asikhia, O. U. (2006). Market-focused strategic flexibility and sales growth: Empirical evidence from Nigeria. Unpublished PhD thesis, University of South Africa.
- Beal, R.M. (2000). Competing Effectively: Environmental scanning, competitive strategy and organizational performance in small manufacturing firms. Journal of Small Business Management, 38(1), 18-24.
- Beal, R.M., & Yasai-Ardekani, M. (2000). Performance implications of aligning CEO functional experiences with competitive strategies. Journal of Management, 26(4), 1-13.
- Business Day (2013, July 15). Nigeria Telecoms’ subscription dips as industry growth rate slows.
- Campbell-Hunt, C. (2000). What have we learned about generic competitive strategy? A meta-Analysis. Strategic Management Journal, 21(2), 14-23.
- Dent, J. F. (1990). Strategy, organizations and control: Some possibilities for Accounting Research. Journal of Accounting, Organizations and Society, 15(4), 13-24.
- Dess, G.G., & Davis, V. (1984). Porter’s generic strategies as determinants of strategic membership and organizational performance. Academy of Management Journal, 23(4), 45-55.
- Eliwa, R. A. (2006). A study of customer loyalty and the image of the fine dining restaurant. Unpublished MSc thesis, Oklahoma State University.
- Gibcus, P., & Kemp, R.G.M. (2003). Strategy and small firm performance. Netherlands: Scientific Analysis of Entrepreneurship and SMEs. Retrieved from www.eim.nl/smes-and-entrepreneurship.
- Gray, J.H. (1997). Small Business strategy in Australia. Academy of Entrepreneurship Journal, 2(2), 52-63.
- Hambrick, D.C. (1981). Strategic awareness within top management teams. Strategic Management Journal, 2(5), 21-32.
- Hambrick, D.C. (1983). Some tests of the Snow’s strategic types. Academy of Management Journal, 26(6), 24-33.
- Hoque, Z. (2004). A contingency model of the association between strategy, environmental uncertainty and performance measurement: Impact on organizational performance. International Business Review, 13(3), 485- 502.
- Jermias, J. (2008). The relative influence of competitive intensity and business strategy on the relationship between financial leverage and performance. The British Accounting Review, 40(7), 71-86.
- Johnson, G., & Scholes, V. (2002). Exploring corporate strategy: Text and cases. Oxford: Pearson Education.
- Kazmi, A. (2008). Strategic Management and Business Policy. New Delhi, India: Tata Mc Graw Hill Publishing Company.
- Khan, A. (2008).Market orientation, customer selectivity and firm performance. Unpublished PhD thesis, Cranfield University.
- Kotha, S., & Vadlamani, B.L. (1995). Assessing generic strategies: An empirical investigation of two competing typologies in discrete manufacturing industries. Strategic Management Journal, 16(12), 37-46.
- Miles, R.E., & Snow, C.C. (1978). Organizational Strategy, Structure and Process. New York, USA: Mc Graw-Hill.
- Miller, D. (1988). Relating porter’s business strategies to environment and structure: Analysis and performance implications. Academy of Management Journal, 31(8), 51-62.
- Minarik, M. (2007). Cost Leadership & Differentiation-An investigation of the fundamental trade-off between Porter’s cost leadership and differentiation strategies. Unpublished MSc thesis, Stockholm School of Economics.
- Murphy, G.B., Trailer, J.W., & Hill, R.C. (1996). Measuring Performance in entrepreneurship research. Journal of Business Research, 36(4), 67-78.
- Nayyar, P.R. (1993). Performance effects of information asymmetry and scope in diversified service firms. Academy of Management Journal, 36(3), 89- 100.
- NCC. (2013). Nigerian Consumer Satisfaction Survey. Retrieved from http:// www.nigeriacommunicationcomission.com.
- Oyedijo, A. I. (2013). Business Policy and Strategic management: An introductory text with cases. Lagos, Nigeria: Strategic International Press.
- Oyedijo, A. I. (2012). Competitive strategy orientations of small and medium business owners and their performance impacts: The case of paint manufacturing SMEs in south-western Nigeria. Journal of Asian Business Strategy, 2(1), 1-8.
- Papulova, E., & Papulova, V. (2006). Competitive strategy and competitive advantages of small and midsized manufacturing enterprises in Slovakia. E-Leader, Slovakia Management Journal, 4(3), 1-8.
- Parker, A.R. (2000). Impact on the organizational performance of the strategytechnology policy interaction. Journal of Business Research, 47(2), 96- 104.
- Parnell, J.A. (1997). New evidence in the generic strategy and business performance debate: A research note. British Journal of Management, 8(7), 24-31.
- Parnell, J.A., & Wright, P. (1993). Generic Strategy and performance: An empirical test of the miles and snow typology. British Journal of Management, 4(1), 11-19.
- Porter, M. E. (1980). Competitive strategy: Techniques for analysing industries and competitors. New York, USA: Free Press.
- Porter, M.E. (1985). Competitive Advantage: Creating and sustaining superior performance, New York. USA: Free Press.
- Porter, M.E. (1996). What is Strategy? Harvard Business Review, 74(2), 23- 27.
- Prajogo, D. I., & Sohal, A. S. (2006). The relationship between organization strategy, total quality management (TQM), and organization performancethe mediating role of TQM. European Journal of Operational Research, 16(3), 35-50.
- Proff, H. (2000). Hybrid Strategies as a Strategic Challenge: The case of the germane automative industry. Omega, 28(5), 68-79.
- Salawu, R.O. (2008, May 5). Nigeria Telecommunication Industry. Nigeria: Tell Magazine.
- Spencer, S. Y., Joiner, T. A., & Salmon, V. (2009). Differentiation strategy, performance measurement systems and organizational performance: Evidence from Australia. International Journal of Business, 14(1), 83- 103.
- Tepeci, M. (1999). Increasing brand loyalty in hospitality Industry. International Journal of Contemporary Hospitality Management, 11(5), 223-230.
- Thompson, J.C., & Strickland, A.J. (2010). Strategic Management: Concepts and Cases. New Jersey: Business Publications Inc.
- Venkatraman, N., & Ramanujam, V. (1996). Measurement of business performance in strategy research: A comparison of approach. Academy of Management Review, II(1), 57-69.
- Ward, P.T., & Druay, R. (2000). Manufacturing Strategies in context: environment, competitive strategy and manufacturing strategy. Journal of Operations Management, 18(2), 120-133.
- Yoo, J.W., Lemak, D.J., & Choi, Y. (2006). Principle of Management and Competitive Strategies: Using Fayol to implement Porter. Journal of Management History, 12(4), 94-107.
Appendix
| Kaiser-Meyer-Olkin Measure of Sampling Adequacy. | .870 | |
| Bartlett's Test of Sphericity | Approx. Chi-Square | 30275.461 |
| df | 28 | |
| Sig. | .000 | |
| Cronbach's Alpha | N of Items |
| .971 | 8 |
Research survey on the competitive strategies and improved performance of selected Nigeria telecommunication companies
Dear Respondents,
This questionnaire is designed to obtain data on the competitive strategy and improved performance of selected telecommunication companies in Nigeria. This research is purely for academic purpose and no respondent shall be implicated. Also all responses shall be treated in strict confidentiality. The researcher therefore, strongly solicits your support and objective responses.
Thank you.
Researcher.
Demographic characteristics of the respondents
- Sex: Male ( ) Female ( )
- Marital Status: Married ( ) Single ( ) Divorced ( )
- Local Government Area Council of Lagos State………………………………
- Age:……………………
- Telephone Provider: MTN ( ) Airtel ( ) Globacom ( ) Etisalat ( )
- Years of customer with the telephone provider: Less than a year ( ) 1- 5years ( )
- 6-10years ( ) More than 10 years ( )
- 7. Educational Qualification: SSCE ( ) OND/NCE ( ) B.Sc/HND ( ) M.Sc/ MBA( )
Ph.D ( ) Others ( )
Competitive strategy and performance
This scale is designed to find out how competitive strategies improved performance of selected Nigeria telecommunication companies. Please tick the column you find appropriate to each question below. The indicators are: SA (Strongly Agree) A (Agree) UD (Undecided) and D (Disagree).
1. Hypothesis 1: Lower pricing do not influence customer satisfaction
| S/N | Questions | SA | A | UD | D | SD |
|---|---|---|---|---|---|---|
| 1 | My telephone provider charges reasonable price for quality service hence my choice. | |||||
| 2 | I use my telephone often because my telephone provider charges lower price. | |||||
| 3 | I stay for a long time for conversation because of the lower price of my telephone provider. | |||||
| 4 | Charging of lower prices attracts more customers to my telephone provider. | |||||
| 5 | Charging of lower price does not reduce customer satisfaction. | |||||
| 6 | Charging of lower price attracts me to my telephone provider. | |||||
| 7 | Charging of lower price does not undermine quality service. | |||||
| 8 | I rely on my provider because of the lower price he charges |
1. Hypothesis 2: Uninterrupted and Quality Trunk services do not influence customer loyalty
| S/N | Questions | SA | A | UD | D | SD |
|---|---|---|---|---|---|---|
| 1 | My telephone provider ensures telephone service is available at all locations throughout the country. | |||||
| 2 | My telephone provider ensures uninterrupted services at all locations. | |||||
| 3 | My telephone provider network is excellent. | |||||
| 4 | My telephone provider services are available at all times. | |||||
| 5 | The service delivery of my provider is better than that of other network. | |||||
| 6 | I prefer my network provider because of its international connections. |
1. Hypothesis 3: Customer Complaints Handling does not influence customer retention
| S/N | Questions | SA | A | UD | D | SD |
|---|---|---|---|---|---|---|
| 1 | I prefer my service provider because it provides uninterrupted services to its customer. | |||||
| 2 | Customers prefer my service provider because it makes the customer to enjoy their services. | |||||
| 3 | My service provider provides immediate solutions to customer complaints. | |||||
| 4 | My service providers does not waste customer’s time. | |||||
| 5 | My telephone provider attends to my complaints promptly. | |||||
| 6 | My telephone provider rectifies any fault on their system without delay. | |||||
| 7 | My telephone provider’s company employees treat their customers with respect. | |||||
| 8 | My telephone provider staff monitor their system to solve customers’ problem without complaints. | |||||
| 9 | I do not hesitate to get another telephone because of the excellent service of my telephone provider. | |||||
| 10 | My telephone provider provides immediate solution to problems. | |||||
| 11 | Customer’s complaint section employees of my telephone providers are very courteous and friendly with customer. |
Biographical note
Waidi Adeniyi Akingbade, doctoral candidate and lecturer in the Department of Business Administration, Faculty of Management Sciences, Lagos State University, Ojo, Lagos, Nigeria. His research interests focus on Strategic Management and Entrepreneurial Studies. He has published in reputable national and international journals and co-author a management text book.