


Received 18 January 2023; Revised 10 May 2023, 20 June 2023; Accepted 28 June 2023.
This is an open access paper under the CC BY license (https://creativecommons.org/licenses/by/4.0/legalcode).
Yoshiaki Nose, Professor, Graduate School of Business, Doshisha University, Karasuma-higashi-iru, Imadegawa, Kamigyo-ku, 602-8580, Kyoto, Japan, e-mail: This email address is being protected from spambots. You need JavaScript enabled to view it., corresponding author. 
Chie Hosomi, Member, Doshisha Business School Network, Karasuma-higashi-iru, Imadegawa, Kamigyo-ku, 602-8580, Kyoto, Japan, e-mail: This email address is being protected from spambots. You need JavaScript enabled to view it.
Abstract
PURPOSE: The first objective of this study is to identify the factors that contribute to the success of equity crowdfunding (ECF) campaigns in Japan. We examined what makes a campaign successful using data from 217 campaigns conducted on FUNDINNO, Japan’s largest ECF platform, between February 2017 and May 2021. The second objective is to assess individual investors’ financial literacy based on the ECF campaign’s success or failure. This study is unique in that it focuses on funding method differences as well as the contents of the business plans disclosed in the ECF campaigns. In Japan, a common equity campaign and stock acquisition rights campaign are run on the same ECF platform, as if they were the same type of funding. Common stock and stock acquisition rights are treated differently by venture capitalists and other professional investors. By comparing the success or failure of the two Japanese projects, we can assess individual investors’ financial literacy after taking into account the project signals. METHODOLOGY: The “Signaling Hypothesis” and the “Lack of Financial Literacy Hypothesis” were tested. Nine and four variables were set as proxy variables for the Signaling Hypothesis and the Lack of Financial Literacy Hypothesis, respectively. This study first divides the qualitative data into success/failure dichotomies for the proxy variables that comprise the hypotheses and then uses a chi-square test to examine the composition ratio of each. The quantitative data among the hypotheses’ proxy variables are then tested for differences in means (t-test) and medians (Wilcoxon signed-rank test). Subsequently, we perform a probit analysis with the explained variable being “success (1)/failure (0)” and the explanatory variable being a proxy variable for the hypothesis. We begin with a probit analysis, and the Logit model is then introduced. Finally, a multiple regression analysis is run with the explained variables “fundraising rate” and “number of investors” and the hypothesized proxy variables as explanatory variables. FINDINGS: We found that the “number of directors” is an effective management ability indicator of ECF success. In terms of start-up fundamentals, investors appear to accept the signals “intellectual property”, “product releases” and “tax incentives.” Awards affected the size of the final funding round. In contrast, B2C companies negatively signaled to private investors. The proxy variable “in final year sales” was supported concerning the lack of a financial literacy hypothesis. Individual investors can be assumed to be financially literate if they perform due diligence. However, since “expected rate of return (Internal Rate of Return, hereafter abbreviated as IRR)” and “common stock dummy” are uncorrelated, we can conclude that they do not demonstrate financial literacy in “valuation,” nor whether or not the investment is profitable. Thus, individual investors’ financial literacy in the Japanese ECF can be considered to be limited. IMPLICATIONS: We have demonstrated which signals investors in Japan’s ECF campaigns respond to. These guidelines will be useful for future start-ups planning ECF campaigns. We were able to identify the lack of financial literacy among ECF individual investors. Therefore, for Japan’s equity capital market to grow in the future, individual investors’ financial literacy must be improved. ORIGINALITY AND VALUE: With very limited analysis in Asia, home to the world’s second- and third-largest stock markets, we have identified the factors behind the success of Japan’s ECF. Identifying success factors in a country like Japan, where many individual investors are extremely risk averse, will provide new insights. By comparing the success or failure of the two types of Japanese ECF projects (common equity projects and stock acquisition rights), we could test the financial literacy of individual investors, taking into account the project signals.
Keywords: equity crowdfunding, financial literacy hypotheses, signaling theory, individual investors, IRR, internal rate of return, management ability, investors, capital market, success factors
INTRODUCTION
This study is an empirical investigation into the signals that lead to successful fundraising in Japanese equity crowdfunding (hereinafter ECF). The means of raising funds for start-ups are expanding as the information society develops. Crowdfunding is one of such means. Crowdfunding is a method of raising funds from an unspecified number of people via the Internet (Bruton et al., 2015; Drover et al., 2017).
Additionally, ECF is expanding in Japan. However, it remains unclear why ECF among Japanese retail investors has begun to gain traction. Private equity investments have historically been made by professional investors, such as venture capitalists and angel investors, because of their high risk. Numerous experts viewed the development of ECF in Japan with skepticism (Fujii et al., 2021). Why has ECF taken off against the expectations of experts? From the perspective of campaign success factors, this study seeks to validate this question. The success factors of ECF are becoming clear, especially in Europe and the United States (US). However, empirical studies of ECF success factors in Asia, including Japan, are extremely limited.
This study is a continuation of the study by Fujii et al. (2021) and presents empirical results for their remaining issues. The first objective of this study is to identify the success factors of ECF campaigns in Japan. Using data from 217 campaigns conducted on FUNDINNO, Japan’s largest ECF platform, between February 2017 and May 2021, we examined what makes a campaign successful.
The second objective is to check the financial literacy of individual investors based on the success or failure of the ECF campaign. Fujii et al. (2021) mainly focused on the valuations of each project and found a lack of financial literacy among individual investors. We determined their financial literacy even after considering the impact of prevailing success signals identified by previous studies. This study is unique in that it focuses on funding method differences and contents of the business plans disclosed in the ECF campaigns. In Japan, a common equity campaign and a stock acquisition rights campaign are run on the same platform for ECF, as if they were the same type of funding. Of course, it is noted which type the project is. However, on the webpage, the two types are listed without distinction. Common stock and stock acquisition rights are distinctly different for venture capitalists and other professional investors. Stock acquisition rights are very similar to what is known as SAFE (Simple Agreement for Future Equity) or KISS (Keep It Simple Security) overseas. With SAFE and KISS, the stock price at the time of raising is determined later. These frameworks are extremely professional.
We tested the “Signaling Hypothesis” and the “Lack of Financial Literacy Hypothesis”. Through statistical analysis, we discovered that several signals were significantly correlated with ECF success. We also found that Japanese retail investors have limited financial literacy.
This paper is structured as follows. Section 2 reviews previous research on ECF. Section 3 describes the verification hypotheses and verification methods. Section 4 details the analysis results. Section 5 summarizes the results of the analysis and describes the future prospects.
Market overview
Crowdfunding is classified into five types: donation, reward, lending, funding, and equity (Hornuf & Neuenkirch, 2016). The returns received by investors differ depending on the type of crowdfunding (Table 1). Since 2013, equity crowdfunding has been used in the United Kingdom (UK) as a new method of raising funds through the sale of stocks and stock acquisition rights. Returns can be stock dividends or capital gains on stocks. The majority of companies that raise funds through ECF are start-ups. Unlike listed stocks, start-up stocks are not easily traded. They have low liquidity and they cannot be converted into cash without an initial public offering (IPO) or a merger and acquisition (M&A).
Table 1. Crowdfunding types
|
Procurer’s accounting treatment |
Returns |
|
|
Equity |
Capital stock and capital reserve |
Dividends on shares, Gain on sale of shares and stock acquisition rights |
|
Debt |
Loans payable |
Interest |
|
Fund |
Deposits received from silent partnerships |
Distributions (dividends) based on sales |
|
Rewards |
Advance received (accounts receivable) |
Products, services, and benefits |
|
Donation |
Non-operating income |
Certificate of appreciation, etc. |
The Financial Instruments and Exchange Law in Japan was partially revised in May 2014. Prior to the revision, unlisted companies had to submit securities registration statements along with audit reports if they wanted to solicit more than 50 investors to purchase shares. The revision removed the limit on the number of applicants on the Web, and companies can now raise funds of less than 100 million yen (700,000 USD). Individual investors may invest no more than 500,000 yen (3,000 USD) per company per year. The platforms must register with the government, screen start-ups that offer shares, and disclose information during campaigns. In response to this legislative change, an equity-based crowdfunding platform was launched in April 2017 (Matsuo, 2018). Because of the risk of fraud and trouble associated with investing in unlisted stocks, soliciting investment by phone or visiting investors is prohibited.
According to the Japan Securities Dealers Association, ECF in Japan has increased since regulations were lifted in 2017, with a target of 2,463 million yen (21 million USD) in 2020. As of October 2021, the amount of assistance had already surpassed that of the previous year (Figure 1). To date, 354 campaigns have been launched, with a success rate of approximately 70% (193 campaigns). In Japan, ECF is divided into common stock and stock acquisition rights, with approximately 75% of common stock and approximately 25% of stock acquisition rights.
Six brokerage firms, including FUNDINNO, are currently registered with the Japan Securities Dealers Association. FUNDINNO was the first approved platform and launched in Japan in November 2016. In December 2021, the platform assisted in raising 7.24 billion yen, ran 221 successful campaigns, and had nearly 88,000 registered investors. FUNDINNO controls approximately 80% of the ECF market in Japan.
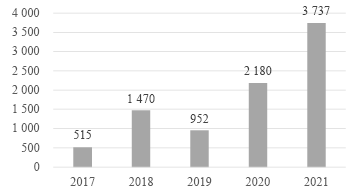
Figure 1. Amount of funds raised through equity crowdfunding in Japan (Millions of yen)
As noted in the previous section, in Japan, a common equity campaign and a stock acquisition rights campaign are run on the same platform for ECF, as if they were the same type of funding. Table 2 compares common stock and stock options in ECF campaigns to stock options in general. The most important feature of stock acquisition rights is that the valuation of the investment can be postponed to a future date. While this can speed up the financing process by postponing the most difficult procedures, investors also take on significant valuation risks. For this reason, SAFEs and KISSs are generally used by professional investors with a high level of financial literacy on the premise of investment diversification.
Table 2. Difference between common stock and stock acquisition rights
|
Common stock |
Stock acquisition rights |
General stock options |
|
|
Dividends |
Yes |
None |
None |
|
Voting rights |
Yes |
None |
None |
|
Right to claim Distribution of residual assets |
Yes |
None |
None |
|
Invalidation |
Not expired |
Expires after a certain period (e.g., 7 years) |
Expires after a certain period of time |
|
Conversion price |
- |
Determined after the fact (e.g., 80% of the share price of the next non-equity CF capital increase) |
Determined at the time of issuance |
|
Price to be paid |
Purchase price of shares |
Payment for the purchase of shares is made in advance |
Option price only (often free of charge) |
|
How to Exit |
Sale |
Excise or Sale |
None |
LITERATURE REVIEW AND HYPOTHESIS
Signaling hypothesis
Although ECF has only been used for about ten years, research is slowly accumulating. The analysis of campaign success factors has been studied primarily in the UK. Table 3 shows the countries and periods that have been analyzed in previous studies. Following the UK, research is being carried out in the US, Australia, and various European countries. We have also found some empirical studies focusing on Asian countries. Moreover, there are several non-empirical studies dealing with ECF campaigns in Middle Eastern countries. According to a comprehensive study conducted by Mochkabadi and Volkmann (2018), so-called “campaign research” that analyzes success factors by constructing multiple regression analysis models with campaign success or failure as the dependent variable and the hypothesis of success signals as the independent variable, has made the most progress in ECF. Therefore, we have also attempted to conduct “campaign research” in our study.
Table 3. Major previous studies
|
Literature |
Country/Platform |
Period |
sample size |
|
Ahlers et al. (2015) |
Australia ASSOB |
2006–2011 |
104 |
|
Allison et al. (2017) |
USA Kickstarter |
2011 |
383 Entrepreneurs |
|
Cumming et al. (2021) |
UK Crowdcube, AIM |
2013–2016 |
Crowdcube167, AIM99 |
|
Dehghani et al. (2023) |
Iran |
2020 |
408 individual investors |
|
El hajj et al.(2022) |
Lebanon |
2020 |
147 start-ups and 10 entrepreneurs |
|
Fajarini et al. (2021) |
Indonesia, Malaysia, UAE, South Korea |
2018–2019 |
201 |
|
Guenther et al. (2018) |
Australia ASSOB |
2006–2012 |
104 |
|
Hellmann et al. (2019) |
UK Seedrs |
2012–2017 |
767 |
|
Horvát et al. (2018) |
UK |
2012–2016 |
698 |
|
Mamonov and Malaga (2018) |
USA 16 platforms |
2016–2017 |
133 |
|
Ralcheva and Roosenboom (2016) |
UK Crowdcube |
2012–2015 |
541 |
|
Ralcheva and Roosenboom (2020) |
UK Crowdcube, Seedrs |
2012–2014 |
2171 |
|
Shafi (2021) |
UK Crowdcube |
2015–2016 |
207 |
|
Vismara (2016) |
UK Crowdcube, Seedrs |
2011–2014 |
271 |
|
Vismara (2018) |
UK Crowdcube |
2014 |
111 |
|
Vismara (2019) |
UK |
2014–2015 |
345 |
|
Vulkan et al. (2016) |
UK Seedrs |
2012–2015 |
636 |
|
Wasiuzzamann and Suhili (2023) |
Malaysia 5 platforms |
2016–2020 |
97 |
What does previous research indicate as a successful campaign factor? Many previous studies have suggested the use of “signals.” In other words, the hypothesis is that specific signals provided by fundraising companies increase the likelihood of successful fundraising in ECF campaigns. According to the signaling theory on which this hypothesis is based, reliable signals enable companies to convey positive information that allows investors to identify good investment opportunities (Spence, 1978). Investors believe that receiving high-quality signals eliminates the information asymmetry that has been a major barrier to investing in start-ups.
Following our extensive review, we were able to categorize the candidates for signals that increase a campaign’s success factor as “management competence,” “company fundamentals,” “SNS (Social Networking Service) activity,” “past invested performance,” and “tax incentives.” The following section describes the findings of previous research on each of these topics.
Signals about management competence
Previous research has demonstrated that the greater the number of board members, the greater the likelihood of a successful campaign. For example, Ralcheva and Roosenboom (2020) examined 2,171 campaign data from the two largest ECF platforms in the UK (Crowdcube and Seedrs) and found a positive correlation between the number of managers and the success rate of campaigns. According to their interpretation, the number of managers is a proxy variable for a start-up’s human assets. Vismara (2019) also demonstrated that the number of top managers has a significant impact on the success of a campaign.
Similar reports have been made during campaigns in other nations. According to Mamonov and Malaga’s (2018) analysis of 133 data points from 16 US platforms and Ahlers et al. (2015) analysis of 104 ECF events on the Australian platform ASSOB, the greater the number of executives, the more successful the campaign. Meanwhile, Mamonov and Malaga (2018) interpreted that start-up success requires a variety of specialized skills, such as product development, marketing, and finance; the presence of multiple individuals with these specialized skills attests to the start-up’s quality.
Prior research has consistently found that campaigns are more likely to succeed if the management team has experience in the business associated with the start-up seeking funding. For instance, Shafi (2021) showed that the more experience a campaign’s founder has in a related industry, the more funds it raises. Allison et al. (2017) also demonstrated that similar experience in previous management positions increases the probability of successful campaigns. They explain that their experience in related businesses has improved their management skills and that investors have responded favorably to the signal.
As a related experience, some previous studies have examined the relationship between entrepreneurial experience and the success or failure of campaigns. Nonetheless, there is a mixture of positively correlated (Allison et al., 2017; Piva & Rossi-Lamastra, 2018) and negatively correlated (Blaseg et al., 2021; Mamonov et al., 2017; Shafi, 2021) findings.
Some studies have focused on the age of managers. According to Ralcheva and Roosenboom’s (2020) logistic analysis, the age of a director is significantly negatively correlated with campaign success, suggesting that younger management is more likely to be successful in fundraising. Meanwhile, Blaseg et al. (2021) demonstrated that ECF is downstream of pecking order theory and is typically utilized by younger managers who lack access to alternative funding sources.
Other research has focused on female founders and managers. For example, Vismara (2016), and Cumming et al. (2021) found that projects with female founders raised statistically significantly less money, which he attributed to a weak female social network. Moreover, Blaseg et al. (2021) noted that female founders are more likely to leverage ECF further down the pecking order because they have less access to alternative funding sources.
In this study, two hypotheses were established based on the previous studies mentioned. The first is Hypothesis 1-1, which considers the number of managers to be a proxy variable for management quality.
H1-1: The number of directors increases the probability of campaign success.
The second is Hypothesis 1-2, which was based on the finding that female founders are less capable of raising funds.
H1-2: Female founders’ campaigns have a lower success rate.
Signals about corporate fundamentals
When an outside third party positively evaluates a start-up’s resources, it can be a signal that the start-up is of high quality. When retail investors use that signal as a guide, the presence or absence of a third-party evaluation can influence a campaign’s success or failure. Patents and Intellectual Property may be the most obvious external assessment for start-ups. Previous studies have found that Intellectual Property has a positive correlation with campaign success (Horvát et al., 2018; Piva & Rossi-Lamastra, 2018; Ralcheva & Roosenboom, 2016; Vismara, 2018; Wang et al., 2019). According to their interpretation, having Intellectual Property signals to investors that the company can innovate and has reliable technology and management (Ralcheva & Roosenboom, 2016; Cumming et al., 2021; Horvát et al., 2018; Mamonov & Malaga, 2018; Ralcheva & Roosenboom, 2020).
Awards and grants are also clear external evaluations. Winning a rigorous professional selection is a sign of the quality of a start-up or its management (Allison et al., 2017; Blaseg et al., 2021; Ralcheva & Roosenboom, 2016, 2020).
So far, we have grouped the term “start-up” into the discussion, but start-ups have different phases. For example, the seed, early, middle, and later stages are well known, and the earlier stages are riskier and require higher expected returns. The stage of a start-up is said to influence its success even in ECF campaigns. Specifically, multiple studies have found that start-ups that already have a product on the market and are selling it (i.e., after the early stages) have a higher probability of campaign success (Mamonov & Malaga, 2018; Ralcheva & Roosenboom, 2016; Vismara, 2018). The nature of the business may also be affected. Specifically, business-to-consumer (B2C) businesses, who are selling products or services directly to consumers, are more accessible to individual investors and therefore easier to finance (Mamonov & Malaga, 2018).
In the present study, four hypotheses were established based on the previous studies mentioned. The first is Hypothesis 1-3, which considers intellectual property as evidence of superior management resources; intellectual property takes time from application to approval. Most of our samples are start-ups whose intellectual properties are in the process of being filed. Given that they are considered protected from filing to final approval, we included firms with pending applications in this study.
H1-3: Filing or possessing Intellectual Property increases the probability of
a successful campaign.
Next is Hypothesis 1-4, which considers an award to be a high-quality, positive signal.
H1-4: Award-winning campaigns increase the probability of success.
Hypothesis 1-5 states that the release of a product or service will increase stakeholder awareness.
H1-5: If the product or service has already been released, the campaign’s
probability of success increases.
Finally, Hypothesis 1-6 considers B2C (business-to-consumer) businesses to be more familiar to individual investors.
H1-6: Campaigns of companies whose businesses include B2C have a higher
probability of success.
Track record of investment by investors
In entrepreneur finance, investment history is of utmost importance. For instance, venture capitalists and other professional investors conduct exhaustive due diligence before investing. Venture capitalists value the start-ups in which they invest. If they are a prominent venture capital firm or investor, their investments frequently have a brand effect.
There are scattered studies indicating that the participation of business professionals increases the success rate of ECF campaigns. For instance, the regression model of Ralcheva and Roosenboom (2016) indicates that accelerator participation positively influences campaign success. Additionally, ECF permits repeated fundraising on the same platform. Therefore, if the start-up grows, second and third campaigns will be solicited. Past success in ECF also has a positive signal effect on individual investors, which increases the likelihood of success for the second and third campaigns (Shafi, 2021).
We established two hypotheses based on these considerations. The Hypothesis 1-7 deals with past track records.
H1-7: Past track record of fundraising through ECF increases the probability of
campaign success.
Hypothesis 1-8 evaluates the participation of professional investors.
H1-8: Probability of campaign success increases if professional investors invest
in the campaign.
To attract investors to invest in start-ups, governments have created tax incentives. With a tax incentive, individual investors can purchase company shares at a lower price for the reduced tax. Several ECF campaigns allow investors to benefit from tax incentives. Several prior studies have indicated that this tax incentive positively affects the success of ECF (Hellmann et al., 2019; Mochkabadi & Volkmann, 2018; Vulkan, Åstebro & Sierra, 2016), that the tax benefit has no effect (Vismara, 2016, 2018), and that tax incentive evaluations are inconsistent. Therefore, we set Hypothesis 1-9.
H1-9: Campaigns eligible for angel taxation have a higher probability of success.
Signals using SNS
ECF is a type of fundraising activity that takes place over the Internet. As a result, there is a consistent tendency for fundraising campaigns run by start-ups and management with active SNS activity via the Internet to be more successful. Specifically, Facebook activity is positively associated with fundraising success (Allison et al., 2017; Lukkarinen, Teich, Wallenius & Wallenius, 2016; Mollick, 2014; Aprilia & Wibowo, 2017). More LinkedIn connections of founders boost campaign success (Piva & Rossi-Lamastra, 2018; Vismara, 2016, 2018). In this case, the number of connections is likely to indicate the strength of an entrepreneur’s business network to retail investors. These papers point out that high-profile executives and investors in the entrepreneur’s LinkedIn are checked, which signals their viability as a start-up. This hypothesis is outside the scope of this paper’s testing due to data limitations.
Table 4 lists the proxy variables associated with ECF success factors and their significance.
Table 4. Summary of the analysis of equity crowdfunding success factors
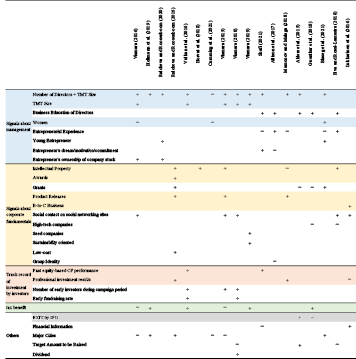
Note: +: significantly positive, −: significantly negative. TMT means top management team. Colored variables are those analyzed in this study.
Lack of financial literacy hypothesis
Indeed, many people questioned the popularity of ECF when it first began (Matsuo, 2017). This is because unlisted stock transactions have always been conducted by professional investors who perform professional due diligence to determine the value of the issuing company. In ECF, however, individual investors must perform due diligence. Do individual investors really have such financial literacy?
Most previous research on the financial literacy of investors investing in ECFs has focused on issuer fraud. For example, Ivanov and Knyazeva (2017), Wilson and Testoni (2014), and Mochkabadi and Volkmann (2018) discussed how to prevent damage caused by fraud and how far regulation should cover it. Moreover, Signori and Vismara (2016) presented the case of Rebus, a company that raised £816,790 and went bankrupt in less than a year. Prior research indicating fraudulent activities by issuers and platforms inevitably calls for tighter regulation (Goethner et al., 2021; Goethner et al., 2021).
However, investors are not always the victims of fraud either; Fujii et al. (2021) is the only previous study focusing on the offering format in Japanese ECF. Our research included 109 transactions from 2017 to 2020. They disaggregated campaign success/failure by common stock/stock acquisition rights and discovered no statistically significant difference in success rates between the two. Moreover, they stated that “a stock acquisition rights project, in which even professional investors are unable to calculate internal rate of returns (IRRs), is completed at the same rate as a common stock project; this suggests that individual investors lack financial literacy.” Furthermore, due diligence on the business plans revealed that many samples did not meet the listing criteria, even if the start-ups were to achieve their goals in the future. In other words, even if the issuer or platform discloses information properly, individual investors may not use it or may invest in ECF using completely different information unnecessary for their investment decisions. Individual investors who are not financially literate may free ride on individual investors who are also not financially literate in ECF (Agrawal et al., 2014; Hornuf & Schmitt, 2016; Mochkabadi & Volkmann, 2018; Wilson & Testoni, 2014).
Investors who lack financial literacy are more likely to fail and, according to Gaudecker (2015) and Meoli and Vismara (2021), those with little mathematical knowledge fail to diversify and lose investment returns. Mintjes (2016) conducted an independent study and confirmed Gaudecker’s (2015) hypothesis. Individual investors with low financial literacy who invest in ECF temporarily stimulate start-up finance. However, if their investments turn out to be a slew of failures after a few years, the recently emerged promising FINTECH ECFs will become worthless (Collins & Pierrakis, 2012).
The Lack of Financial Literacy Hypothesis assumes that individual investors are either unable or unwilling to comprehend the information and signals provided by start-ups and platforms and therefore invest “without understanding” and “somehow.” Financial literacy in this context does not refer to a superficial understanding of the information disclosed in ECF, but rather determines whether or not they can perform “due diligence” and “valuation” (Fujii et al., 2021), which professional investors, such as venture capitalists, take for granted.
This study will examine the four proxy variables for financial literacy. The first variable is investing in stock acquisition rights. If Japanese investors had adequate financial literacy, they would be more hesitant to invest in stock acquisition rights. At the very least, the probability of success should be lower than for campaigns involving common stock. In this study, we use the success rate of common stock campaigns as a proxy for individual investors’ financial literacy.
H2-1: Campaigns with a common stock offering type are more likely to succeed
(campaigns with stock acquisition rights have a lower success rate)
The second variable is an exit through an IPO. The capital strategy road map influences the decisions of investors (Guenther et al., 2018).
According to Ahlers et al. (2015), the success rate of campaigns targeting an IPO with an exit strategy is higher than campaigns targeting an M&A or a leveraged buyout (LBO). Prior to that, an IPO is almost the only means of exit for individual investors because the stock trading market for unlisted stocks in Japan is not well developed. In addition, if the business plan does not include an IPO date, IRR cannot be estimated. Therefore, projects that do not aim for an IPO must be avoided by individual investors. However, projects with ambiguous exit timing and methods have succeeded in raising funds in Japan’s ECF. Japanese individual investors may invest without thinking about exit. Based on these considerations, we set up hypothesis H2-2:
H2-2: Campaigns of companies seeking to exit by IPO have a higher probability
of success.
The third variable is sales in the final year of the business plan. Each company’s business plan is presented in FUNDINNO’s ECF in the form of three detailed financial tables. If individual investors had the literacy to read and comprehend this detailed table of numbers, they would adjust their investment decisions accordingly. Suppose, for instance, that there are two types of companies: company A, which is anticipated to experience significant revenue growth in the future, and company B, which is not anticipated to experience significant growth in the future. Individual investors would favor firm A over firm B. Therefore, we formulate Hypothesis H2-3.
H2-3: The likelihood of a successful campaign increases in proportion to the final
year’s sales (natural logarithm) stated in the business plan.
Lastly, the fourth variable is IRR. Indeed, as Fujii et al. (2021) demonstrate, based on the information disclosed by the platform, Japanese common stock ECF projects can estimate IRR on an investment if the investee goes through an IPO. Such valuation skills are essential in start-up finance and will be used by financially literate individual investors. Therefore, we set up hypothesis H2-4.
H2-4: The higher the IRR, the more likely the campaign will be successful.
Issues in prior research
Prior research on factors influencing the success of ECF campaigns has analyzed which signals have the greatest impact on campaign success. The number of directors is a common factor influencing success, which studies in the UK, US, Australia, and Germany indicate as a positive correlation (Table 4). Additionally, “directors have received business education” and “being young entrepreneurs” are positively significant, according to previous research. The success of ECF campaigns is affected not only by the number of people but also by the characteristics of those whose directors are young, promising, and have business educations. Intellectual property correlated significantly positively in the UK, Australian, and Italian studies, but negatively in the US study. Previous studies have also reported significant correlations between receiving “grants” and having received “awards.” This may be a sign to look for good firms among unlisted firms with a significant information asymmetry.
Typically, venture capitalists and business angels invest in geographically nearby businesses. However, the literature on ECF is divided into two groups: those that argue that distance is associated with campaign success and those that do not. Several studies also indicated that social networking contact is a success factor. In ECF, information asymmetry is resolved primarily through IT networks; thus, geographical proximity may be irrelevant in ECF. As mentioned previously, prior research has demonstrated several significant proxy variables that rely on signaling theory.
However, previous studies are skewed heavily toward cases in the UK and the US. The analysis of success factors for ECF fundraising in Asia, which has the second- and third-largest stock markets in the world, is very limited. Are the success factors of ECF in the East and West identical? Do different markets have distinct ECF success factors? A multifaceted study is now required. This study aims to identify the universal factors that contribute to the success of ECF financing by analyzing data from Japan, which is commonly regarded as having distinctive characteristics from the West.
In fact, Japan’s financial assets have characteristics not found in other countries. Table 5 shows the composition of financial assets held by households in Japan, the US, and Europe. Japanese households hold ¥2005 trillion in assets, of which 54.3% is in cash and deposits and only 14.7% is in stocks and mutual funds. This is only one-third of that in the US, where 52.4% of assets are invested in stocks and mutual funds, and only half of that in Europe, where 29.9% of assets are invested in stocks and mutual funds. In other words, Japanese individual investors are extremely risk averse compared to those in other countries.
Table 5. Households’financial asset composition
|
Country/Area and Household Financial Assets |
Cash & Deposits |
Stocks and Mutual Funds |
Insurance, Pension, Others |
|
Japan (14.85 trillion dollars) |
54.3% |
14.7% |
31.0% |
|
US (115.5 trillion dollars) |
13.7% |
52.4% |
33.9% |
|
Euro-Area (32 trillion dollars) |
34.5% |
29.9% |
35.6% |
Note: As of March 31, 2022. Compiled by the author from Bank of Japan statistical data.
On the contrary, ECF is one of the riskiest investments. Although previous studies have focused on relatively risk-taking countries, we believe that identifying success factors in a country like Japan, where many individual investors are extremely risk averse, will provide new insights. The Japanese government has been encouraging individuals to invest their idle cash and deposits, and the current study provides a glimpse into this goal. Our study also provides material for considering approaches to risk-averse individual investors in the US and Europe. Given these factors, the present study does not simply provide additional data from a single Asian country.
In addition, improving the financial literacy of individual investors who invest in ECF is essential for the future development of ECF. However, none of the previous campaign studies emphasized financial literacy. Prior studies have contributed to the analysis of what individual investors focus on in their equity crowdfunding, which is unquestionably important. However, individual investors may not actually focus on anything.
In Japan’s ECF, two distinct “products,” namely common stock and stock acquisition rights, are sold concurrently as if they were the same. Stock acquisition rights are such a complex product that even venture capitalists have difficulty valuing them. This type of ECF market is unique in Japan when compared to the rest of the world. We have previously indicated that Japanese individual investors may not distinguish between common stock and stock acquisition rights and we emphasized the lack of financial literacy among individual investors (Fujii et al., 2021). However, a comprehensive empirical analysis that accounts for more variables remains an issue, which is addressed in this study.
DATA AND ANALYSIS METHODOLOGY
This study employs qualitative and quantitative data from campaigns on FUNDINNO, Japan’s largest platform, which handles approximately 80% of ECF campaigns in the country. This study uses 217 campaigns from FUNDIINNO’s first project from February 2017 to May 2021. An empirical analysis is conducted using the statistical model with the campaign data.
IRR estimation method used in this study is the same as that used by Fujii et al. (2021). Specifically, IRR is defined as the return “if the business performance progresses as planned and the company goes public” based on the business plan presented by each start-up. The IRR formula (1) is as follows: The estimated market capitalization at IPO is calculated by multiplying the expected net income by the actual price-to-earnings ratio (PER) of companies listed in that industry. The estimated market capitalization at the time of the IPO is determined by multiplying the expected net income by the industry’s actual PER. The IRR is defined as the compound annual rate of return on the amount invested.

where n is the number of years between the investment and the IPO.
The investment amount is calculated as “the share price offered in each offering campaign × the number of shares”. For convenience, this study assumes that one investor purchases all of the shares issued in the campaign. The shareholding ratio was calculated as “number of newly issued shares / (number of shares outstanding at the time of offering + number of newly issued shares + stock options)”. The shareholding ratio was calculated by dividing the number of newly issued shares by (the number of shares issued at the time of the offering + the number of newly issued shares + stock options). Note that many start-ups raise equity financing following their subsequent growth stages, which dilutes their traditional shareholdings.
Table 6 summarizes the hypotheses tested in this study and their proxy variables.
Table 6. Proxy variables for hypotheses
|
Hypothesis |
Attribute |
Proxy variables |
Explanation |
Positive or negative |
|
Explained variable Percentage raised Number of investors |
Campaign Success or Failure |
Whether the campaign was successful or not (success = 1, failure = 0) |
||
|
Amount raised divided by the target amount |
||||
|
Number of investors who applied for the campaign |
||||
|
Signaling hypothesis |
Signals about Management |
Number of directors |
Number of board members |
Positive |
|
Female founders dummy |
Whether the founder is a woman (including if there are women in the founding group) (women = 1, men = 0) |
Negative |
||
|
Signals about company fundamentals |
Intellectual Property Dummy |
Whether the company has any intellectual property (including pending applications) (Yes = 1, No = 0) |
Positive |
|
|
Awards Dummy |
Whether the campaign page mentions any awards (Yes = 1, No = 0) |
Positive |
||
|
Product Releases Dummy |
Whether the product or service has been released (Yes = 1, No = 0) |
Positive |
||
|
B-to-C Business Dummy |
Whether the business includes B-to-C (included = 1, not included = 0) |
Positive |
||
|
Past equity CF Success Dummy |
Whether the business has had equity CF in FUNDINNO in the past (Yes = 1, No = 0) |
Positive |
||
|
Professional Investment Dummy |
Whether the business has been funded by angel investors, VC, CVC, or business companies (Yes = 1, No = 0) |
Positive |
||
|
Tax Incentives Dummy |
Whether the campaign is eligible for angel taxation (eligible = 1, not eligible = 0) |
Positive |
||
|
Lack of Financial Literacy Hypothesis Exit by IPO dummy ln Final Year Sales IRR |
Common Stock Dummy |
Stock acquisition rights = 0, common stock = 1 |
No correlation or negative |
|
|
Whether the company is aiming to exit through an IPO (aiming = 1, not aiming = 0) |
No correlation or negative |
|||
|
Natural logarithm of sales in the last year of the business plan |
No correlation or negative |
|||
|
Expected rate of return on investment in that campaign (Internal Rate of Return) |
No correlation or negative |
|||
|
Control variable Large city dummy Shareholder perks Dummy |
Number of years since establishment |
Number of years since establishment |
||
|
Whether the company is located in Tokyo (Tokyo = 1, outside Tokyo = 0) |
||||
|
Whether the company has shareholder perks (Yes = 1, No = 0) |
||||
Control variables
The variables of the number of years since establishment, location, and shareholder perks are control variables that are not directly related to the hypotheses but can affect the campaign’s success or failure. Agency theory states that investors should invest in more local firms because it is easier to obtain information about firms and exercise voting rights in them. Meanwhile, ECF is said to alleviate some distance-related constraints, including monitoring business conditions, providing information, and gathering information (Agrawal et al., 2014).
Wilson and Testoni (2014) point out that, in addition to the geographical problem of monitoring, ECF is a one-time event for many investors, which increases the possibility of fraud. In theory, investors in start-ups should be in the neighborhood (Agrawal et al., 2011). This is because gathering information and monitoring progress are particularly important for investors, and the cost of these activities is determined by distance. However, the previous financing’s reliance on geographic distance is not seen in ECF (Agrawal et al., 2011). However, Guenther et al. (2018) claimed that investors, including venture capitalists and business angels, are aware of geographic distance in ECF.
The system of shareholder perks allows shareholders to receive goods and services from the investing company. This is a unique Japanese system that has been shown to benefit individual investors in listed stocks (Nose et al., 2021) and may influence investment behavior in ECF.
Analysis method
This study first divides the qualitative data into success/failure dichotomies for the proxy variables that comprise the hypotheses, and then use a chi-square test to examine the composition ratio of each.
The quantitative data among the hypotheses’ proxy variables are then tested for differences in means (t-test) and medians (Wilcoxon signed-rank test). Equation (2) is used to compute the difference.
Difference = mean/median in successful campaign – mean/median in unsuccessful campaign (2)
Subsequently, we perform a probit analysis with the explained variable being “success (1)/failure (0)” and the explanatory variable being a proxy variable for the hypothesis. We begin with a probit analysis, as described by Vulkan et al. (2016), Vismara (2019), Vismara, Benaroio and Carne (2017), Shafi (2021), Blaseg et al. (2021), Piva and Rossi-Lamastra (2018), and others. The fundamental model (3) is as follows:

where Φ() is the cumulative distribution function of the standard normal distribution, and xij denotes the jth variable supporting the success factor for campaign i.
We then also introduce the Logit model used by Horvát et al. (2018), Allison et al. (2017), Mamonov and Malaga (2018), and Guenther et al. (2018). The basic model equation is as follows.
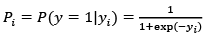
where yi takes the values 0 and 1, y = 1 is success, P is the probability of a successful campaign, i.e., y = 1 taking the values 0 and 1, and Pi is the probability of success for campaign i. The formula for yi is as follows.
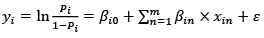
In this case, x represents the hypothetical proxy or control variable, and denotes the error term.
Finally, to assess the robustness of the analysis results, multiple regression analysis was conducted. Based on previous studies, the explained variables are “funding rate” and “number of investors” (Vismara, 2016; Lukkarinen et al., 2016), whereas the explanatory variables are the proxy variables for hypotheses. The multiple regression analysis is performed as follows:
where y is the “rate of fundraising” or “number of investors”, i is the sample, α is the constant term, β is the coefficient of the hypothesis’s explanatory variable, χ is the hypothesis’s proxy variable, n is the n-th variable, and ε is the error term.
Table 7 summarizes the descriptive statistics for the qualitative data’s proxy variables. Common stock and stock acquisition rights are the two types of ECF, and the number of successes and failures for each is described. The presence/absence of each dummy variable indicates success/failure.
Table 7. Descriptive statistics (qualitative data)
|
Common stock |
Stock acquisition rights |
|||
|
Success |
Failure |
Success |
Failure |
|
|
Common Stock or Stock Acquisition Rights |
129 |
41 |
35 |
12 |
|
Yes |
No |
|||
|
Success |
Failure |
Success |
Failure |
|
|
Female Founders |
17 |
4 |
147 |
49 |
|
Intellectual Property |
60 |
10 |
104 |
43 |
|
Awards |
25 |
7 |
139 |
45 |
|
Product Releases |
110 |
22 |
54 |
31 |
|
B2C Business |
68 |
36 |
96 |
17 |
|
Past Equity CF Success |
27 |
8 |
137 |
45 |
|
Professional Investment |
83 |
24 |
81 |
29 |
|
Tax Incentives |
63 |
13 |
100 |
40 |
|
Exit by IPO |
150 |
45 |
14 |
8 |
|
Shareholder Perks |
18 |
8 |
146 |
45 |
|
Large city |
114 |
35 |
50 |
18 |
Table 8 shows the descriptive statistics of the quantitative data. The mean, standard deviation, maximum and minimum values of each variable by success/failure are described.
Table 8. Descriptive statistics (quantitative data)
|
Variables |
Success |
Failure |
|||||||||
|
n |
Mean |
SD |
Min |
Max |
n |
Mean |
SD |
Min |
Max |
||
|
Percentage raised |
164 |
225.4 |
97.2 |
94.5 |
445.5 |
53 |
57.0 |
27.2 |
8.0 |
111.2 |
|
|
Number of investors |
164 |
218.2 |
111.0 |
46.0 |
591.0 |
53 |
58.2 |
46.2 |
13.0 |
286.0 |
|
|
Number of directors |
164 |
2.5 |
1.4 |
1.0 |
7.0 |
53 |
1.8 |
0.9 |
1.0 |
4.0 |
|
|
ln final year sales |
163 |
21.3 |
0.7 |
18.6 |
24.3 |
52 |
20.8 |
1.1 |
14.6 |
22.4 |
|
|
IRR |
128 |
89.0 |
46.1 |
2.3 |
274.4 |
41 |
88.7 |
48.4 |
19.7 |
323.3 |
|
|
Number of years since establishment |
164 |
6.5 |
6.1 |
0.8 |
43.7 |
53 |
6.9 |
6.9 |
0.5 |
37.2 |
|
The correlation coefficient table for each variable is shown in Table 9. Simply looking at the correlation between the campaign’s success or failure and the variables, “ln Final Year Sales,” “Product Releases,” and “Number of Directors” had positive correlations of 0.25, 0.23, and 0.21, respectively, whereas “B2C Business” had a negative correlation of −0.23.
Table 9. Correlation matrix
|
1. Success or Failure |
2. Percentage Raised |
3. Number of Investors |
4. Number of Directors |
5. Female Founders |
6. Intellectual Property |
7. Awards |
8. Product Releases |
9. B-to-C Business |
10. Past Equity CF Success |
11. Professional Investment |
12. Tax Incentives |
13. Common Stock |
14. Exit by IPO |
15. ln final year sales |
16. IRR |
17. Years Since Establishment |
18. Large Cities |
19. Shareholder Perks |
|
|
1 |
1.00 |
0.65*** |
0.57*** |
0.21*** |
0.04 |
0.16** |
0.02 |
0.23*** |
−0.23*** |
0.02 |
0.05 |
0.13 |
0.01 |
0.09 |
0.25*** |
0.00 |
−0.03 |
0.03 |
−0.05 |
|
2 |
0.65*** |
1.00 |
0.74*** |
0.13* |
−0.02 |
0.26*** |
0.24*** |
0.14* |
−0.25*** |
0.18** |
0.13 |
0.15* |
−0.02 |
0.02 |
0.18** |
−0.06 |
−0.02 |
−0.07 |
−0.05 |
|
3 |
0.57*** |
0.74*** |
1.00 |
0.17** |
−0.02 |
0.27*** |
0.21*** |
0.01 |
−0.30*** |
0.11 |
0.13* |
0.00 |
0.00 |
0.08 |
0.25*** |
−0.06 |
0.06 |
−0.02 |
−0.11 |
|
4 |
0.21*** |
0.13* |
0.17** |
1.00 |
0.07 |
−0.02 |
−0.05 |
−0.10 |
−0.11 |
0.21*** |
0.20*** |
0.16** |
0.15* |
0.19** |
0.02 |
−0.14* |
0.02 |
0.06 |
0.06 |
|
5 |
0.04 |
−0.02 |
−0.02 |
0.07 |
1.00 |
0.04 |
−0.13* |
−0.02 |
0.00 |
−0.06 |
0.08 |
0.05 |
−0.09 |
−0.04 |
0.00 |
0.09 |
−0.03 |
−0.01 |
−0.12 |
|
6 |
0.16** |
0.26*** |
0.27*** |
−0.02 |
0.04 |
1.00 |
0.32*** |
0.13* |
−0.23*** |
0.07 |
0.11 |
0.05 |
−0.07 |
0.10 |
−0.01 |
0.05 |
0.09 |
−0.13* |
−0.13* |
|
7 |
0.02 |
0.24*** |
0.21*** |
−0.05 |
−0.13* |
0.32*** |
1.00 |
0.01 |
−0.09 |
0.13* |
0.03 |
0.00 |
−0.03 |
−0.12 |
0.02 |
−0.10 |
0.12** |
−0.17** |
0.01 |
|
8 |
0.23*** |
0.14* |
0.01 |
−0.10 |
−0.02 |
0.13* |
0.01 |
1.00 |
0.00 |
0.12 |
0.04 |
−0.01 |
−0.15* |
0.07 |
−0.02 |
0.08 |
0.03 |
0.01 |
0.01 |
|
9 |
−0.23*** |
−0.25*** |
−0.30*** |
−0.11 |
0.00 |
−0.23*** |
−0.09 |
0.00 |
1.00 |
−0.09 |
−0.08 |
−0.03 |
−0.06 |
−0.04 |
−0.04 |
−0.04 |
−0.16*** |
0.11 |
0.21*** |
|
10 |
0.02 |
0.18** |
0.11 |
0.21*** |
−0.06 |
0.07 |
0.13* |
0.12 |
−0.09 |
1.00 |
0.14* |
0.25*** |
0.20*** |
0.06 |
−0.02 |
−0.06 |
0.02 |
−0.08 |
0.15* |
|
11 |
0.05 |
0.13 |
0.13* |
0.20*** |
0.08 |
0.11 |
0.03 |
0.04 |
−0.08 |
0.14* |
1.00 |
0.15* |
−0.31*** |
0.03 |
0.01 |
0.01 |
−0.01 |
0.05 |
−0.02 |
|
12 |
0.13 |
0.15* |
0.00 |
0.16** |
0.05 |
0.05 |
0.00 |
−0.01 |
−0.03 |
0.25*** |
0.15* |
1.00 |
0.39*** |
0.09 |
−0.09 |
0.01 |
−0.28 |
−0.01 |
0.10 |
|
13 |
0.01 |
−0.02 |
0.00 |
0.15* |
−0.09 |
−0.07 |
−0.03 |
−0.15* |
−0.06 |
0.20*** |
−0.31*** |
0.39*** |
1.00 |
0.05 |
−0.03 |
0.00 |
0.10 |
0.01 |
0.16** |
|
14 |
0.09 |
0.02 |
0.08 |
0.19** |
−0.04 |
0.10 |
−0.12 |
0.07 |
−0.04 |
0.06 |
0.03 |
0.09 |
0.05 |
1.00 |
0.17** |
−0.14* |
0.04 |
−0.03 |
−0.06 |
|
15 |
0.25*** |
0.18** |
0.25*** |
0.02 |
0.00 |
−0.01 |
0.02 |
−0.02 |
−0.04 |
−0.02 |
0.01 |
−0.09 |
−0.03 |
0.17** |
1.00 |
0.14* |
0.04 |
0.13* |
−0.04 |
|
16 |
0.00 |
−0.06 |
−0.06 |
−0.14* |
0.09 |
0.05 |
−0.10 |
0.08 |
−0.04 |
−0.06 |
0.01 |
0.01 |
0.00 |
−0.14* |
0.14* |
1.00 |
−0.02 |
0.19** |
−0.14* |
|
17 |
−0.03 |
−0.02 |
0.06 |
0.02 |
−0.03 |
0.09 |
0.12 |
0.03 |
−0.16** |
0.02 |
−0.01 |
−0.28*** |
0.10 |
0.04 |
0.04 |
−0.02 |
1.00 |
−0.28*** |
−0.07 |
|
18 |
0.03 |
−0.07 |
−0.02 |
0.06 |
−0.01 |
−0.13* |
−0.17** |
0.01 |
0.11 |
−0.08 |
0.05 |
−0.01 |
0.01 |
−0.03 |
0.13* |
0.19** |
−0.28*** |
1.00 |
−0.06 |
|
19 |
−0.05 |
−0.05 |
−0.11 |
0.06 |
−0.12 |
−0.13* |
0.01 |
0.01 |
0.21*** |
0.15* |
−0.02 |
0.10 |
0.16** |
−0.06 |
−0.04 |
−0.14* |
−0.07 |
−0.06 |
1.00 |
Note: ***, **, * Significant at the 1%, 5%, and 10% level, respectively.
RESULTS
What makes an equity crowdfunding successful?
Table 10 displays the results of the chi-square test, which was used to determine whether the difference in proportions between the two groups was statistically significant in campaign success and failure. There was no significant difference in the success rate for equity and stock acquisition rights, which were 76% and 74%, respectively, for the proxy variable “type of offering.” This finding implies that individual investors may make investment decisions without distinguishing between the riskiness of stocks and stock acquisition rights. The findings support the Lack of Financial Literacy Hypothesis.
A dummy variable difference test confirmed that the variables “Intellectual Property,” “Product Releases,” and “Tax Incentives” were significantly positively correlated with campaign success. These are proxies for signals about the offering firm’s fundamentals. The fundraising may be successful because individual investors reacted positively to these signals. Conversely, “B2C Business” is significantly negatively correlated with campaign success at the 1% level. The management proxy variable “female founders” and the financial literacy proxy variable “Exit through IPO” were not significantly correlated.
We also conducted an analysis in which the sample was split into two for common stock and stock acquisition rights and each dummy variable was compared to the percentage of campaign successes or failures. However, given that no significant differences were found, the description was omitted.
Table 10. Chi-square test (qualitative data)
|
Common stock |
Stock acquisition rights |
Pearson’s Chi-square test |
||||||
|
Success |
Failure |
Success |
Failure |
Chi-square |
p-value |
|||
|
Common Stock or |
76% |
24% |
74% |
26% |
0.04 |
0.84 |
||
|
Yes |
No |
Pearson’s Chi-square test |
||||||
|
Success |
Failure |
Success |
Failure |
Chi-square |
p-value |
|||
|
Female Founders |
81% |
19% |
75% |
25% |
0.36 |
0.55 |
||
|
Intellectual Property |
86% |
14% |
71% |
29% |
5.75 |
0.02 |
** |
|
|
Awards |
78% |
22% |
76% |
24% |
0.10 |
0.75 |
||
|
Product Releases |
83% |
17% |
64% |
36% |
10.99 |
0.00 |
*** |
|
|
B-to-C Business |
65% |
35% |
85% |
15% |
11.24 |
0.00 |
*** |
|
|
Past equity CF Success |
77% |
23% |
75% |
25% |
0.06 |
0.81 |
||
|
Professional Investment |
78% |
22% |
74% |
26% |
0.46 |
0.50 |
||
|
Tax Incentives |
83% |
17% |
71% |
29% |
3.50 |
0.06 |
* |
|
|
Exit by IPO |
77% |
23% |
64% |
36% |
1.89 |
0.17 |
||
|
Shareholder perks |
69% |
31% |
76% |
24% |
0.64 |
0.42 |
||
|
Large City |
77% |
23% |
74% |
26% |
0.23 |
0.64 |
||
Note: ***, **, * Significant at the 1%, 5%, and 10% level, respectively.
Table 11 shows the results of statistical tests of mean and median differences for quantitative variables, categorizing campaigns as successful or unsuccessful. At the 1% level, the number of directors is significantly higher in successful campaigns than in unsuccessful campaigns, indicating good management. Individual investors may prefer start-ups with a collective management structure over sole proprietors.
Table 11. Tests of difference (quantitative data)
|
Success |
Failure |
Mean difference |
t-value |
Median difference |
z-value |
|||||||||
|
n |
mean |
median |
n |
mean |
median |
|||||||||
|
Percentage raised |
164 |
225.4 |
199.8 |
53 |
57.0 |
56.4 |
168.4 |
12.44 |
*** |
143.4 |
10.81 |
*** |
||
|
Number of investors |
164 |
218.2 |
189.0 |
53 |
58.2 |
47.0 |
160.1 |
14.90 |
*** |
142.0 |
9.88 |
*** |
||
|
Number of directors |
164 |
2.5 |
2.0 |
53 |
1.8 |
2.0 |
0.6 |
3.80 |
*** |
0.0 |
2.79 |
*** |
||
|
ln final year sales |
163 |
21.4 |
21.3 |
52 |
20.8 |
20.9 |
0.5 |
3.84 |
*** |
0.4 |
3.41 |
*** |
||
|
IRR |
128 |
89.0 |
84.2 |
41 |
88.7 |
80.0 |
0.2 |
0.03 |
4.3 |
0.19 |
||||
|
Years since establishment |
164 |
6.5 |
5.3 |
53 |
6.9 |
4.9 |
−0.4 |
−0.45 |
0.4 |
−0.12 |
||||
Note: *** Significant at the 1% level.
For successful projects, final year sales, a proxy variable for the financial literacy hypothesis, are also significantly higher at the 1% level. This finding implies that individual investors are using financial literacy to decipher the detailed business-plan number tables disclosed in ECF. The expected rate of return, however, is not significantly different. We interpret their financial literacy as limited. We further conducted an analysis in which the sample was divided into common stock and stock acquisition rights, however, no significant differences were found.
Cross-section analysis
The results of the probit analysis with the success dummy as the explained variable and the proxy variables associated with the Signaling Hypothesis and Lack of Financial Literacy Hypothesis are presented in Table 12. Model (1)(2) is the foundation model. Campaign success is significantly correlated with the variables “Number of Directors,” “Product Releases,” “Tax Incentives,” “Intellectual Property,” and “ln Final year Sales.” Individual investors may actively evaluate and invest in projects that have a collective management structure, a product that has already been released, Intellectual Property, and are deemed worthy of angel taxation by the government. Individual investors may also be reading the business plan and conducting due diligence on how large the start-up will grow. Meanwhile, B2C businesses are significantly negatively correlated with campaign success. Individual investors may avoid companies that are simple to understand.
Models (3) and (4) check for a proxy variable for the Lack of Financial Literacy Hypothesis and the Common Stock Dummy. In Japanese ECF, common stock projects and stock acquisition rights projects are mixed. Stock acquisition rights are a financial technique for professional investors with diversified investments. We have determined that stock acquisition rights are not suitable for individual investors.
Therefore, we assume that financially literate investors will avoid stock acquisition rights projects, and that their success rate will be lower than that of common stock projects (the success rate of common stock projects is significantly higher). In other words, if the “common stock dummy” is positively correlated with campaign success, Models (3) and (4) are consistent with the hypothesis. The coefficients, however, are not significantly related to campaign success. This implies that individual investors who participate in ECF may be investing “without regard” of whether the campaign is an offering of common stock or stock acquisition rights. The findings support the Hypothesis of Financial Illiteracy.
Model (5) shows the results of an additional test of the Lack of Financial Literacy Hypothesis by including the investment’s “IRR” as an explanatory variable. Projects with a higher expected rate of return would have a higher success rate if individual investors used “valuation” literacy. Because the expected rate of return for stock acquisition rights projects cannot be estimated, this model is only estimated for common stock projects. As a result, we discovered that the “IRR” had no bearing on the project’s success or failure. In addition, the variables “Exit by IPO,” was not significant across all models in Table 12. Individual investors may assess the income statement of the business plan but not the exit plan. These findings support the Lack of Financial Literacy Hypothesis.
Table 12. Probit analysis with success dummy as explained variable
|
Variables |
(1) |
(2) |
(3) |
(4) |
(5) |
|
Model 1 |
Model 2 |
Model 3 |
Model 4 |
Model 5 |
|
|
Dependent variable: Success dummy |
|||||
|
Variables |
(1) |
(2) |
(3) |
(4) |
(5) |
|
Model 1 |
Model 2 |
Model 3 |
Model 4 |
Model 5 |
|
|
Number of directors |
0.314*** |
0.319*** |
0.320*** |
0.322*** |
0.428*** |
|
(0.110) |
(0.106) |
(0.111) |
(0.106) |
(0.137) |
|
|
Female founders |
0.324 |
0.250 |
0.314 |
0.242 |
−0.452 |
|
(0.423) |
(0.405) |
(0.427) |
(0.407) |
(0.481) |
|
|
Intellectual Property |
0.303 |
0.438* |
0.306 |
0.439* |
|
|
(0.264) |
(0.257) |
(0.264) |
(0.257) |
||
|
Awards |
0.012 |
0.004 |
0.010 |
0.001 |
−0.158 |
|
(0.333) |
(0.334) |
(0.335) |
(0.335) |
(0.366) |
|
|
Product Releases |
0.793*** |
0.774*** |
0.768*** |
0.761*** |
0.863*** |
|
(0.221) |
(0.217) |
(0.225) |
(0.221) |
(0.257) |
|
|
B-to-C Business |
−0.619*** |
−0.632*** |
−0.444* |
||
|
(0.232) |
(0.233) |
(0.259) |
|||
|
Past Equity CF Success |
−0.397 |
−0.331 |
−0.374 |
−0.317 |
−0.436 |
|
(0.328) |
(0.320) |
(0.331) |
(0.323) |
(0.347) |
|
|
Professional Investment |
−0.248 |
−0.241 |
−0.322 |
−0.279 |
−0.293 |
|
(0.235) |
(0.229) |
(0.270) |
(0.261) |
(0.306) |
|
|
Tax Incentives |
0.456* |
0.472* |
0.532* |
0.513* |
0.533* |
|
(0.258) |
(0.253) |
(0.292) |
(0.286) |
(0.303) |
|
|
Equity Dummy |
−0.196 |
−0.102 |
- |
||
|
(0.350) |
(0.336) |
||||
|
Exit by IPO |
−0.218 |
−0.278 |
−0.218 |
−0.279 |
−0.0659 |
|
(0.360) |
(0.359) |
(0.362) |
(0.359) |
(0.428) |
|
|
ln Final Year Sales |
0.604*** |
0.573*** |
0.606*** |
0.573*** |
0.718*** |
|
(0.171) |
(0.165) |
(0.172) |
(0.166) |
(0.217) |
|
|
IRR |
−0.002 |
||||
|
−0.003 |
|||||
|
Years since Establishment |
−0.012 |
−0.005 |
−0.008 |
−0.003 |
−0.010 |
|
(0.019) |
(0.018) |
(0.020) |
(0.019) |
(0.023) |
|
|
Large Cities |
0.028 |
0.002 |
0.061 |
0.018 |
−0.096 |
|
(0.251) |
(0.243) |
(0.257) |
(0.248) |
(0.300) |
|
|
Shareholder perks |
−0.111 |
−0.281 |
−0.080 |
−0.268 |
−0.323 |
|
(0.341) |
(0.335) |
(0.345) |
(0.338) |
(0.365) |
|
|
Constant |
−12.68*** |
−12.34*** |
−12.59*** |
−12.29*** |
−15.19*** |
|
(3.572) |
(3.460) |
(3.589) |
(3.469) |
(4.441) |
|
|
Observations |
213 |
213 |
213 |
213 |
167 |
|
LR chi2 = |
55.460 |
48.110 |
55.770 |
48.200 |
46.370 |
|
Prob > chi2 = |
0.000 |
0.000 |
0.000 |
0.000 |
0.000 |
|
Log likelihood = |
−89.514 |
−93.188 |
−89.355 |
−93.142 |
−68.751 |
|
Pseudo R2 = |
0.237 |
0.205 |
0.238 |
0.206 |
0.252 |
Note: Standard errors in parentheses, *** p < 0.01, ** p < 0.05, * p < 0.1.
Robustness check
We conducted robustness tests to validate the dependability of our results. Table 13 displays the results of the logistic regression with the success dummy as the explained variable, and the proxy variables associated with the Signaling Hypothesis and the Lack of Financial Literacy Hypothesis as the explanatory variables. As shown in Table 12, Models (1) and (2) are the foundational models; similar to the probit analysis outcomes, the variables “Number of Directors,” “Product Releases,” “Tax Incentives,” “Intellectual Property,” and “ln final year sales” are significantly positively correlated with campaign success. These indicators appear to affect the effectiveness of ECF campaigns. In this analysis, the coefficient for B2C transactions is also significantly negative at the 1% level in this analysis as well.
Models (3) and (4) are models established to check the “common stock dummy,” which is a proxy variable for the Lack of Financial Literacy Hypothesis. Model (5) shows the results of an additional test of the Lack of Financial Literacy Hypothesis by adding the “IRR” of the investment as an explanatory variable.
These results indicate that specific variables consistently support the “Signaling Hypothesis” As firm fundamentals, the specific variables are “number of directors,” “product releases,” “tax incentives,” and “Intellectual Property.” On the other hand, proxy variables other than “ln Final year sales” were not significant, as shown in Table 12, and the “Lack of Financial Literacy Hypothesis” was supported throughout the research.
Table 13. Logistic analysis with success dummy as explained variable
|
Variables |
(1) |
(2) |
(3) |
(4) |
(5) |
|
Model 1 |
Model 2 |
Model 3 |
Model 4 |
Model 5 |
|
|
Dependent variable: Success dummy |
|||||
|
Variables |
(1) |
(2) |
(3) |
(4) |
(5) |
|
Model 1 |
Model 2 |
Model 3 |
Model 4 |
Model 5 |
|
|
Number of directors |
0.554*** |
0.560*** |
0.566*** |
0.568*** |
0.751*** |
|
(0.195) |
(0.186) |
(0.197) |
(0.188) |
(0.243) |
|
|
Female founders |
0.518 |
0.419 |
0.488 |
0.384 |
−0.901 |
|
(0.767) |
(0.748) |
(0.767) |
(0.750) |
(0.825) |
|
|
Intellectual Property |
0.647 |
0.861* |
0.648 |
0.866* |
|
|
(0.482) |
(0.475) |
(0.483) |
(0.476) |
||
|
Awards |
−0.0246 |
−0.0679 |
−0.0293 |
−0.0793 |
−0.284 |
|
(0.577) |
(0.581) |
(0.580) |
(0.583) |
(0.632) |
|
|
Product Releases |
1.371*** |
1.329*** |
1.330*** |
1.302*** |
1.481*** |
|
(0.390) |
(0.384) |
(0.398) |
(0.390) |
(0.454) |
|
|
B-to-C Business |
−1.064*** |
−1.078*** |
−0.821* |
||
|
(0.409) |
(0.411) |
(0.457) |
|||
|
Past Equity CF Success |
−0.697 |
−0.612 |
−0.653 |
−0.580 |
−0.770 |
|
(0.573) |
(0.549) |
(0.578) |
(0.554) |
(0.598) |
|
|
Professional Investment |
−0.379 |
−0.381 |
−0.512 |
−0.471 |
−0.470 |
|
(0.410) |
(0.401) |
(0.482) |
(0.469) |
(0.558) |
|
|
Tax Incentives |
0.812* |
0.830* |
0.942* |
0.921* |
0.974* |
|
(0.458) |
(0.450) |
(0.518) |
(0.511) |
(0.541) |
|
|
Equity Dummy |
−0.328 |
−0.226 |
- |
||
|
(0.616) |
(0.598) |
||||
|
Exit by IPO |
−0.396 |
−0.488 |
−0.403 |
−0.498 |
−0.189 |
|
(0.612) |
(0.608) |
(0.616) |
(0.611) |
(0.731) |
|
|
ln Final Year Sales |
1.017*** |
0.990*** |
1.029*** |
0.999*** |
1.206*** |
|
(0.298) |
(0.290) |
(0.301) |
(0.293) |
(0.380) |
|
|
IRR |
−0.00306 |
||||
|
(0.00499) |
|||||
|
Years since Establishment |
−0.0207 |
−0.00863 |
−0.0146 |
−0.00418 |
−0.0126 |
|
(0.0321) |
(0.0323) |
(0.0341) |
(0.0344) |
(0.0421) |
|
|
Large Cities |
0.0308 |
−0.0324 |
0.0797 |
−0.00101 |
−0.141 |
|
(0.447) |
(0.431) |
(0.455) |
(0.438) |
(0.521) |
|
|
Shareholder perks |
−0.241 |
−0.530 |
−0.194 |
−0.500 |
−0.583 |
|
(0.572) |
(0.549) |
(0.578) |
(0.555) |
(0.613) |
|
|
Constant |
−21.37*** |
−21.35*** |
−21.41*** |
−21.41*** |
−25.49*** |
|
(6.207) |
(6.050) |
(6.242) |
(6.082) |
(7.764) |
|
|
Observations |
213 |
213 |
213 |
213 |
167 |
|
LR chi2 = |
55.650 |
48.530 |
55.940 |
48.670 |
46.100 |
|
Prob > chi2 = |
|||||
|
Log likelihood = |
−89.414 |
−92.970 |
−89.271 |
−92.904 |
−68.935 |
|
Pseudo R2 = |
0.237 |
0.207 |
0.239 |
0.208 |
0.250 |
Note: Standard errors in parentheses, *** p < 0.01, ** p < 0.05, * p < 0.1.
The results of a multiple regression analysis with the procurement rate (amount raised/solicited) as the explained variable and the proxy variables for the hypotheses as explanatory variables are shown in Table 14. The results show a positive correlation at the 1% level for “ln Final Year Sales,” at the 5% level for “Intellectual Property,” “Product Releases,” and “Awards Received,” and at the 10% level for “Number of Directors” and “Tax Incentives.” “B2C Business” is negative and significant at the 1% level. The results are largely consistent with Tables 12 and 13. The only difference is that in Table 14 Model 1, the coefficient of awards received is significantly positive at the 5% level. Although any start-up seeking funding should aim for a successful campaign, it appears that “winning awards” is important in order to obtain more funding.
Model 2 depicts the results of including “IRR” as an explanatory variable in order to test the Lack of Financial Literacy Hypothesis further. As the IRR cannot be estimated for stock acquisition rights projects, the sample in model (2) is limited to common stock projects. The analysis results show that the “IRR” and “Exit by IPO” are not significant. Individual investors lack the financial literacy of “valuation.” Other results were generally consistent with Tables 12, 13, and Table 14 Model 1. A study on reward-based crowdfunding conducted by Pinkow (2022) showed that factors affecting project success/failure differ from those affecting fundraising rate (overfunding). In Japanese ECF, project success/failure and fundraising rate are expected to be affected by almost the same factors.
Table 14. Multiple regression analysis with funding rate (amount raised/amount offered) as the explained variable
|
Dependent variable: Percentage raised (amount raised/amount offered) |
|||||||||
|
Variables |
Model 1 |
Model 2 |
|||||||
|
Estimated value |
Standard error |
t-value |
Estimated value |
Standard error |
t-value |
||||
|
Number of directors |
10.77 |
5.84 |
1.84 |
* |
12.32 |
6.19 |
1.99 |
** |
|
|
Female founders |
−12.47 |
25.03 |
−0.5 |
−48.25 |
29.07 |
−1.66 |
* |
||
|
Intellectual Property |
34.38 |
16.7 |
2.06 |
** |
31.18 |
17.49 |
1.78 |
* |
|
|
Awards |
49.43 |
21.67 |
2.28 |
** |
|||||
|
Product Releases |
31.37 |
14.83 |
2.12 |
** |
38.77 |
16.04 |
2.42 |
** |
|
|
B-to-C Business |
−40.16 |
15.05 |
−2.67 |
*** |
−28.93 |
16.61 |
−1.74 |
* |
|
|
Professional Investment |
9.03 |
16.29 |
0.55 |
−2.48 |
18.17 |
−0.14 |
|||
|
Tax Incentives |
31.36 |
18.5 |
1.69 |
* |
41.96 |
18.66 |
2.25 |
** |
|
|
Equity Dummy |
−10.61 |
22.05 |
−0.48 |
||||||
|
Exit by IPO |
−25.43 |
24.79 |
−1.03 |
−7.21 |
28.91 |
−0.25 |
|||
|
ln Final Year Sales |
26.91 |
8.35 |
3.22 |
*** |
31.77 |
11.92 |
2.66 |
*** |
|
|
IRR |
−0.21 |
0.18 |
−1.19 |
||||||
|
Years since Establishment |
−1.18 |
1.3 |
−0.91 |
−0.27 |
1.41 |
−0.19 |
|||
|
Large Cities |
−16.59 |
16.53 |
−1 |
||||||
|
Shareholder perks |
−6.2 |
23.63 |
−0.26 |
−8.68 |
24.18 |
−0.36 |
|||
|
Intercept |
−392.52 |
175.8 |
−2.23 |
** |
−523.74 |
245.57 |
−2.13 |
** |
|
|
N |
213 |
167 |
|||||||
|
adjusted R-squared |
0.170 |
0.138 |
|||||||
Note: ***, **, * Significant at the 1%, 5%, and 10% level, respectively.
Table 15 Model 3 displays the findings of a multiple regression analysis using the same explanatory variables as in Table 14, with the number of investors who invested in ECF as the explained variable. The “Number of Directors” and “Intellectual Property” are positively correlated at the 5% level, whereas “Awards Received” is positively correlated at the 10% level. “B2C Business” shows a negative and significant correlation at the 1% level. We obtain results that are generally consistent with the results of our previous analyses when we change the combination of explanatory variables.
Table 15. Results of multiple regression analysis with number of investors as explained variable
|
Variables |
Model 3 |
Model 4 |
|||||||
|
Estimated value |
Standard error |
t-value |
Estimated value |
Standard error |
t-value |
||||
|
Dependent variable: number of investors |
|||||||||
|
Variables |
Model 3 |
Model 4 |
|||||||
|
Estimated value |
Standard error |
t-value |
Estimated value |
Standard error |
t-value |
||||
|
Number of directors |
13.24 |
6.34 |
2.09 |
** |
14.40 |
6.79 |
2.12 |
** |
|
|
Female founders |
−11.26 |
26.92 |
−0.42 |
−50.19 |
31.11 |
−1.61 |
|||
|
Intellectual Property |
45.05 |
17.95 |
2.51 |
** |
32.11 |
18.74 |
1.71 |
* |
|
|
Awards |
41.91 |
23.46 |
1.79 |
* |
|||||
|
Product Releases |
−1.67 |
16.14 |
−0.1 |
||||||
|
B-to-C Business |
−49.74 |
16.21 |
−3.07 |
*** |
−33.41 |
17.83 |
−1.87 |
* |
|
|
Past Equity CF Success |
10.02 |
22.6 |
0.44 |
13.89 |
22.28 |
0.62 |
|||
|
Professional Investment |
20.71 |
17.71 |
1.17 |
13.71 |
19.67 |
0.70 |
|||
|
Tax Incentives |
−14.49 |
20.02 |
−0.72 |
−6.94 |
20.24 |
−0.34 |
|||
|
Equity Dummy |
9.42 |
23.98 |
0.39 |
||||||
|
Exit by IPO |
0.42 |
26.65 |
0.02 |
−5.37 |
30.91 |
−0.17 |
|||
|
ln Final Year Sales |
32.43 |
8.98 |
3.61 |
*** |
45.85 |
12.73 |
3.60 |
*** |
|
|
IRR |
−0.23 |
0.19 |
−1.22 |
||||||
|
Years since Establishment |
−0.66 |
1.39 |
−0.47 |
−0.76 |
1.55 |
−0.49 |
|||
|
Large Cities |
−3.74 |
17.82 |
−0.21 |
−1.32 |
19.73 |
−0.07 |
|||
|
Shareholder perks |
−17.2 |
25.62 |
−0.67 |
−28.68 |
26.10 |
−1.10 |
|||
|
Intercept |
−539.44 |
189.01 |
−2.85 |
*** |
−787.36 |
261.64 |
−3.01 |
** |
|
|
N |
213 |
167 |
|||||||
|
adjusted R-squared |
0.231 |
0.140 |
|||||||
Note: ***, **, * Significant at the 1%, 5%, and 10% level, respectively.
Model 4 depicts the results of including “IRR” as an explanatory variable to test the Lack of Financial Literacy Hypothesis further. The analysis results show that the “IRR” and “Exit by IPO” are not significant. On the contrary, “ln final year sales” is significant at the 1% level in both Models (3) and (4). These results suggest that individual investors are literate enough to check the business plans disclosed by start-ups to some extent (due diligence). However, they can be considered to lack the financial literacy to estimate the return on their investments (valuation) at the time of exit.
The results of the above analysis revealed the following. To begin, the “Signaling Hypothesis” is consistently supported in certain variables, including the number of directors (positive), Intellectual Property (positive), product releases (positive), awards received (weakly positive), and B2C Business (negative). Individual investors are expected to view these signals positively (negatively).
The findings supported the hypothesis of a lack of financial literacy. Individual investors in Japanese ECF, according to the study, do not consider whether a project is common stock or stock acquisition rights, which is a critical factor in investment decisions. In addition, unlike professional investors, individual investors do not appear to calculate the IRR (valuation). Sales in the final year of the business plan disclosed in ECF projects, on the other hand, consistently demonstrated significant positive correlations with each of the variables: project success or failure, funding rate, and number of investors. This suggests that, to a lesser extent, individual investors check business plans. That is to say, we interpret that their financial literacy is limited.
Finally, to summarize our analysis, we present Table 16, which adds our empirical results to the right-hand side of Table 6.
Table 16. Research hypotheses and results of this study
|
Hypothesis |
Attribute |
Proxy Variables |
Explanation |
Positive or Negative |
Result |
|
Hypothesis |
Attribute |
Proxy Variables |
Explanation |
Positive or Negative |
Result |
|
Signaling hypothesis |
Signals about Management |
Number of directors |
Number of board members |
Positive |
Supported |
|
Female founders dummy |
Whether the founder is a woman (including if there are women in the founding group) (women = 1, men = 0) |
Negative |
Not supported |
||
|
Signals about company fundamentals |
Intellectual Property Dummy |
Whether the company has any intellectual property (including pending applications) (Yes = 1, No = 0) |
Positive |
Supported |
|
|
Awards Dummy |
Whether the campaign page mentions any awards (Yes = 1, No = 0) |
Positive |
Weak Supported |
||
|
Product Releases Dummy |
Whether the product or service has been released (Yes = 1, No = 0) |
Positive |
Supported |
||
|
B-to-C Business Dummy |
Whether the business includes B-to-C (included = 1, not included = 0) |
Positive |
Negatively Supported |
||
|
Past equity CF Success Dummy |
Whether the business has had equity CF in FUNDINNO in the past (Yes = 1, No = 0) |
Positive |
Not Supported |
||
|
Professional Investment Dummy |
Whether the business has been funded by angel investors, VC, CVC, or business companies (Yes = 1, No = 0) |
Positive |
Not Supported |
||
|
Tax Incentives Dummy |
Whether the campaign is eligible for angel taxation (eligible = 1, not eligible = 0) |
Positive |
Supported |
||
|
Lack of Financial Literacy Hypothesis Exit by IPO dummy ln Final Year Sales IRR |
Common Stock Dummy |
Stock acquisition rights = 0, common stock = 1 |
No correlation or negative |
Supported |
|
|
Whether the company is aiming to exit through an IPO (aiming = 1, not aiming = 0) |
No correlation or negative |
Supported |
|||
|
Natural logarithm of sales in the last year of the business plan |
No correlation or negative |
Not Supported |
|||
|
Expected rate of return on investment in that campaign (Internal Rate of Return) |
No correlation or negative |
Supported |
|||
CONCLUSIONS
This study analyzed the factors that lead to successful ECF fundraising for companies that raised funds between 2017 and 2021 on the Japanese ECF platform FUNDINNO. The “Signaling Hypothesis” and the “Lack of Financial Literacy Hypothesis” were tested. After various analyses, we found that the “Number of Directors” is an effective indicator of management. In terms of start-up fundamentals, investors appear to accept the signals “Intellectual Property,” “Product Releases,” and “Tax Incentives” Awards had an effect on the size of the final funding round. In contrast, B2C companies signaled negatively to private investors; entrepreneurs running ECF campaigns with B2C companies must signal to compensate for the disadvantages.
The results of this study are generally consistent with those of previous studies in Europe and the US. Japanese individual investors differ from their Western counterparts, as they are more risk-averse. However, when investing in ECF campaigns, they focused on the same points and received signals from companies to invest.
The proxy variable “ln final year sales” was not supported concerning the Lack of Financial Literacy Hypothesis. We can infer that individual investors are financially literate to the extent that they perform due diligence. However, since “IRR,” “common stock dummy,” and “Exit by IPO” are uncorrelated, Japanese individual investors make investment decisions without checking an IPO schedule in business plans and estimating the IRR of their investments. Given their disinterest in investment valuations, stock acquisition rights projects have been just as successful as common stock projects.
We can therefore conclude that Japanese individual investors do not demonstrate financial literacy in “valuation” that is, whether the investment is profitable or not. Thus, the financial literacy utilized by individual investors in the Japanese ECF can be considered limited.
Through this paper’s analysis, we have demonstrated which signals investors in Japan’s ECF campaigns respond to. These guidelines will be helpful for start-ups planning ECF campaigns in the future.
We were able to point out the lack of financial literacy of individual investors participating in ECF. As Fujii et al. (2021) pointed out; ECF is a win-win FINTECH for both individual investors and start-ups if it is properly utilized in the future. However, if investment decisions are made without evidence by those who lack financial literacy, the current boom will eventually subside, and the financing environment for Japanese start-ups will rapidly deteriorate back to its previous state. Therefore, the financial literacy of individual investors in Japan must be improved for the future growth of the equity capital market. This paper is intended to be a contribution to the discussion. In addition, the lack of financial literacy may not be limited to the Japanese. ECF research worldwide has so far focused on the search for success signals. Their findings call for entrepreneurs to send out higher quality signals. Conversely, our findings indicate that no matter how high quality the signals are, investors may not understand them. The focus on financial literacy has just begun, and we hope that our research framework will be widely used in the future.
This study leaves several issues unresolved. In particular, the history of ECF in Japan is still young, and we have not been able to collect enough campaign data to verify the results. Future campaign-data collection must be expanded to enhance the accuracy of the empirical analysis. This study has only revealed a few of the factors that contribute to successful fundraising in Japanese ECF. Therefore, continued and extensive verification will be required in the future.
Acknowledgments
This study is conducted using data provided by FUNDINNO, Inc. We would like to express our sincere gratitude to FUNDINNO for their willingness to provide us with the data. We also thank Dr. Nobuyuki Yamori for his valuable advice on revisions at the 2022 Japan FP Society Conference. The first author thanks Japan Society for the Promotion of Science (JSPS) Grants-in-Aid for Scientific Research (22K01566) for financial support.
References
Agrawal, A., Catalini, C., & Goldfarb, A. (2011). The geography of crowdfunding. NBER Working Paper, No. 16820, National Bureau of Economic Research, Cambridge, MA. https://doi.org/10.3386/w16820
Agrawal, A., Catalini, C., & Goldfarb, A. (2014). Some simple economics of crowdfunding. Innovation Policy and the Economy, 14(1), 63-97. https://doi.org/10.1086/674021
Ahlers, G. K., Cumming, D., Günther, C., & Schweizer, D. (2015). Signaling in equity crowdfunding. Entrepreneurship Theory and Practice, 39(4), 955-980. https://doi.org/10.1111/etap.12157
Allison, T. H., Davis, B. C., Webb, J. W., & Short, J. C. (2017). Persuasion in crowdfunding: An elaboration likelihood model of crowdfunding performance. Journal of Business Venturing, 32(6), 707-725. https://doi.org/10.1016/j.jbusvent.2017.09.002
Aprilia, L., & Wibowo, S. S. (2017). The impact of social capital on crowdfunding performance. The South East Asian Journal of Management, 11(1), 3. https://doi.org/10.21002/seam.v11i1.7737
Blaseg, D., Cumming, D., & Koetter, M. (2021). Equity crowdfunding: High-quality or low-quality entrepreneurs? Entrepreneurship Theory and Practice, 45(3), 505-530. https://doi.org/10.1177/1042258719899427
Bruton, G., Khavul, S., Siegel, D., & Wright, M. (2015). New financial alternatives in seeding entrepreneurship: Microfinance, crowdfunding, and peer-to-peer innovations. Entrepreneurship Theory and Practice, 39(1), 9-26. https://doi.org/10.1111/etap.12143
Collins, L., & Pierrakis, Y. (2012). The venture crowd: Crowdfunding equity investments into business. London, United Kingdom: Nesta.
Cumming, D., Meoli, M., & Vismara, S. (2021). Does equity crowdfunding democratize entrepreneurial finance? Small Business Economics, 56, 533-552. https://doi.org/10.1007/s11187-019-00188-z
Cumming, D. J., Vanacker, T., & Zahra, S. A. (2021). Equity crowdfunding and governance: Toward an integrative model and research agenda. Academy of Management Perspectives, 35(1), 69-95. https://doi.org/10.5465/amp.2017.0208
Dehghani, M., Piwowar-Sulej, K., Salari, E., Leone, D., & Habibollah, F. (2023). The role of trust and e-WOM in the crowdfunding participation: The case of equity crowdfunding platforms in financial services in Iran. International Journal of Emerging Markets(ahead-of-print). https://doi.org/10.1108/IJOEM-09-2021-1358
Drover, W., Busenitz, L., Matusik, S., Townsend, D., Anglin, A., & Dushnitsky, G. (2017). A review and road map of entrepreneurial equity financing research: Venture capital, corporate venture capital, angel investment, crowdfunding, and accelerators. Journal of Management, 43(6), 1820-1853. https://doi.org/10.1177/0149206317690584
El Hajj, M. C., Chidiac, M., & Awdeh, A. (2022). Entrepreneurs signaling: Promoting equity crowdfunding in Lebanon. Journal of Economic and Administrative Sciences (ahead-of-print). https://doi.org/10.1108/JEAS-12-2021-0249
Fajarini, C., Dalimunthe, Z., & Haikal, S. (2021). What information needed to present in a fundraising campaign through equity crowdfunding. Indonesian Capital Market Review, 13(2), 94-103. http://dx.doi.org/10.2139/ssrn.3923526
Fujii, M., Hosomi, C., & Nose, Y. (2021). Equity crowdfunding and financial literacy of individual investors in Japan. Journal of Capital Markets Studies, 5(1), 5-27. https://doi.org/10.1108/JCMS-03-2021-0007
Gaudecker, H.-M. V. (2015). How does household portfolio diversification vary with financial literacy and financial advice? The Journal of Finance, 70(2), 489-507. https://doi.org/10.1111/jofi.12231
Goethner, M., Hornuf, L., & Regner, T. (2021). Protecting investors in equity crowdfunding: An empirical analysis of the small investor protection act. Technological Forecasting and Social Change, 162, 120352. https://doi.org/10.1016/j.techfore.2020.120352
Goethner, M., Luettig, S., & Regner, T. (2021). Crowdinvesting in entrepreneurial projects: Disentangling patterns of investor behavior. Small Business Economics, 57, 905-926. https://doi.org/10.1007/s11187-020-00332-0
Guenther, C., Johan, S., & Schweizer, D. (2018). Is the crowd sensitive to distance?—How investment decisions differ by investor type. Small Business Economics, 50(2), 289-305. https://doi.org/10.1007/s11187-016-9834-6
Hellmann, T., Mostipan, I., & Vulkan, N. (2019). Be careful what you ask for: Fundraising strategies in equity crowdfunding. Retrieved from SSRN Electronic Journal. http://dx.doi.org/10.2139/ssrn.3448596
Hornuf, L., & Neuenkirch, M. (2016). Pricing shares in equity crowdfunding. Small Business Economics, 48(4), 795-811. https://doi.org/10.1007/s11187-016-9807-9
Hornuf, L., & Schmitt, M. (2016). Success and failure in equity crowdfunding. CESifo DICE Report, 14(2), 16-22. Retrieved from https://www.ifo.de/DocDL/dice-report-2016-2-hornuf-schmitt-june.pdf
Horvát, E.-Á., Wachs, J., Wang, R., & Hannák, A. (2018). The role of novelty in securing investors for equity crowdfunding campaigns. Proceedings of the AAAI Conference on Human Computation and Crowdsourcing, 6(1), 50-59. https://doi.org/10.1609/hcomp.v6i1.13336
Ivanov, V., & Knyazeva, A. (2017). US securities-based crowdfunding under Title III of the JOBS Act. SEC White paper. Retieved from https://www.sec.gov/files/regcf_whitepaper.pdf
Lukkarinen, A., Teich, J. E., Wallenius, H., & Wallenius, J. (2016). Success drivers of online equity crowdfunding campaigns. Decision Support Systems, 87, 26-38. https://doi.org/10.1016/j.dss.2016.04.006
Mamonov, S., & Malaga, R. (2018). Success factors in Title III equity crowdfunding in the United States. Electronic Commerce Research and Applications, 27, 65-73. https://doi.org/10.1016/j.elerap.2017.12.001
Mamonov, S., Malaga, R., & Rosenblum, J. (2017). An exploratory analysis of Title II equity crowdfunding success. Venture Capital, 19(3), 239-256. https://doi.org/10.1080/13691066.2017.1302062
Matsuo, J. (2017). New developments in equity crowdfunding. Shoken Report, (1704), 1-20. (In Japanese).
Matsuo, J. (2018). Expanding Japanese equity crowdfunding. Shoken Report, (1707), 11-36. (In Japanese).
Meoli, M., & Vismara, S. (2021). Information manipulation in equity crowdfunding markets. Journal of Corporate Finance, 67, 101866. https://doi.org/10.1016/j.jcorpfin.2020.101866
Mintjes, D. (2016). The role of financial literacy on portfolio diversification in peer-to-peer lending. Working Paper. Retrieved from https://thesis.eur.nl/pub/36801/Mintjes-D.-431825-.pdf
Mochkabadi, K., & Volkmann, C. K. (2018). Equity crowdfunding: A systematic review of the literature. Small Business Economics, 54(1), 75-118. https://doi.org/10.1007/s11187-018-0081-x
Mollick, E. (2014). The dynamics of crowdfunding: An exploratory study. Journal of Business Venturing, 29(1), 1-16. https://doi.org/10.1016/j.jbusvent.2013.06.005
Nose, Y., Miyagawa, H., & Ito, A. (2021). How do firms attract the attention of individual investors? Shareholder perks and financial visibility. Journal of Behavioral and Experimental Finance, 31, 100520. https://doi.org/10.1016/j.jbef.2021.100520
Pinkow, F. (2022). The impact of common success factors on overfunding in reward-based crowdfunding: An explorative study and avenues for future research. Journal of Entrepreneurship, Management and Innovation, 18(1), 131-167. https://doi.org/10.7341/20221815
Piva, E., & Rossi-Lamastra, C. (2018). Human capital signals and entrepreneurs’ success in equity crowdfunding. Small Business Economics, 51(3), 667-686. https://doi.org/10.1007/s11187-017-9950-y
Ralcheva, A., & Roosenboom, P. (2016). On the road to success in equity crowdfunding. Retrieved from SSRN Electronic Journal. https://doi.org/10.2139/ssrn.2727742
Ralcheva, A., & Roosenboom, P. (2020). Forecasting success in equity crowdfunding. Small Business Economics, 55, 39-56. https://doi.org/10.1007/s11187-019-00144-x
Shafi, K. (2021). Investors’ evaluation criteria in equity crowdfunding. Small Business Economics, 56(1), 3-37. https://doi.org/10.1007/s11187-019-00227-9
Signori, A., & Vismara, S. (2016). Returns on investments in equity crowdfunding. Retrieved from SSRN Electronic Journal. https://doi.org/10.2139/ssrn.2765488
Spence, M. (1978). Job market signaling. In Uncertainty in Economics (pp. 281-306). Amsterdam, Netherlands: Academic Press.
Surowiecki, J. (2005). The wisdom of crowds. New York, NY: Anchor.
Vismara, S. (2016). Equity retention and social network theory in equity crowdfunding. Small Business Economics, 46(4), 579-590. https://doi.org/10.1007/s11187-016-9710-4
Vismara, S. (2018). Information cascades among investors in equity crowdfunding. Entrepreneurship Theory and Practice, 42(3), 467-497. https://doi.org/10.1111/etap.12261
Vismara, S. (2019). Sustainability in equity crowdfunding. Technological Forecasting and Social Change, 141, 98-106. https://doi.org/10.1016/j.techfore.2018.07.014
Vismara, S., Benaroio, D., & Carne, F. (2017). Gender in entrepreneurial finance: Matching investors and entrepreneurs in equity crowdfunding. In Gender and Entrepreneurial Activity. Cheltenham, United Kingdom: Edward Elgar Publishing. https://doi.org/10.4337/9781785364747.00015
Vulkan, N., Åstebro, T., & Sierra, M. F. (2016). Equity crowdfunding: A new phenomena. Journal of Business Venturing Insights, 5, 37-49. https://doi.org/10.1016/j.jbvi.2016.02.001
Wang, W., Mahmood, A., Sismeiro, C., & Vulkan, N. (2019). The evolution of equity crowdfunding: Insights from co-investments of angels and the crowd. Research Policy, 48(8), 103727. https://doi.org/10.1016/j.respol.2019.01.003
Wasiuzzaman, S., & Suhili, N. F. (2023). Examination of the success drivers of equity crowdfunding campaigns in Malaysia. Journal of Entrepreneurship in Emerging Economies, 15(2), 425-446. https://doi.org/10.1108/JEEE-04-2021-0134
Wilson, K. E., & Testoni, M. (2014). Improving the role of equity crowdfunding in Europe’s capital markets. Retrieved from SSRN Electronic Journal. http://dx.doi.org/10.2139/ssrn.2502280
Abstrakt
CEL: Pierwszym celem tego badania jest identyfikacja czynników, które przyczyniają się do sukcesu kampanii finansowania społecznościowego (ECF) w Japonii. Zbadaliśmy, co decyduje o sukcesie kampanii, korzystając z danych z 217 kampanii przeprowadzonych na FUNDINNO, największej japońskiej platformie ECF, w okresie od lutego 2017 r. do maja 2021 r. Drugim celem jest ocena wiedzy finansowej indywidualnych inwestorów na podstawie sukcesu lub porażki kampanii ECF. To badanie jest wyjątkowe, ponieważ koncentruje się na różnicach w metodach finansowania, a także na treści biznesplanów ujawnianych w kampaniach ECF. W Japonii kampania dotycząca akcji zwykłych i praw do nabycia akcji jest prowadzona na tej samej platformie ECF, tak jakby dotyczyły tego samego rodzaju finansowania. Akcje zwykłe i prawa do nabycia akcji są różnie traktowane przez inwestorów venture capital i innych profesjonalnych inwestorów. Porównując sukces lub porażkę dwóch japońskich projektów, możemy ocenić wiedzę finansową poszczególnych inwestorów po uwzględnieniu sygnałów projektu. METODYKA: Zbadano „hipotezę sygnalizacji” i „hipotezę braku wiedzy finansowej”. Dziewięć i cztery zmienne zostały ustawione jako zmienne zastępcze odpowiednio dla hipotezy sygnalizacyjnej i hipotezy braku umiejętności finansowych. To badanie najpierw dzieli dane jakościowe na dychotomie sukces/porażka dla zmiennych zastępczych składających się na hipotezy, a następnie wykorzystuje test chi-kwadrat do zbadania stosunku składu każdej z nich. Dane ilościowe wśród zmiennych zastępczych hipotez są następnie testowane pod kątem różnic w średnich (test t) i medianach (test rang ze znakiem Wilcoxona). Następnie przeprowadzamy analizę probitową, gdzie zmienną objaśnianą jest „sukces (1)/porażka (0)”, a zmienną objaśniającą jest zmienną zastępczą dla hipotezy. Rozpoczynamy od analizy probitowej, a następnie wprowadzamy model Logit. Na koniec przeprowadzana jest analiza regresji wielokrotnej ze zmiennymi objaśnianymi „stopa pozyskiwania funduszy” i „liczba inwestorów” oraz hipotetycznymi zmiennymi zastępczymi jako zmiennymi objaśniającymi. WYNIKI: Stwierdziliśmy, że „liczba dyrektorów” jest skutecznym wskaźnikiem zdolności zarządczych sukcesu ECF. Jeśli chodzi o fundamenty start-upów, inwestorzy wydają się akceptować sygnały „własność intelektualna”, „wydanie produktu” i „zachęty podatkowe”. Nagrody wpłynęły na wielkość ostatniej rundy finansowania. Z kolei firmy B2C negatywnie sygnalizowały inwestorom prywatnym. Zmienna zastępcza „w sprzedaży w ostatnim roku” została poparta w związku z brakiem hipotezy dotyczącej znajomości finansów. Można założyć, że inwestorzy indywidualni posiadają wiedzę finansową, jeśli przeprowadzą due diligence. Ponieważ jednak „oczekiwana stopa zwrotu (wewnętrzna stopa zwrotu, dalej w skrócie IRR)” i „akcje zwykłe” nie są ze sobą skorelowane, możemy stwierdzić, że nie wykazują one wiedzy finansowej w zakresie „wyceny”, ani tego, czy inwestycja jest opłacalna. Tym samym wiedzę finansową inwestorów indywidualnych w zakresie japońskich ECF można uznać za ograniczoną. IMPLIKACJE: Wykazaliśmy, na jakie sygnały reagują inwestorzy w japońskich kampaniach ECF. Te wskazówki będą przydatne dla przyszłych start-upów planujących kampanie ECF. Udało nam się zidentyfikować brak wiedzy finansowej wśród inwestorów indywidualnych ECF. Dlatego, aby japoński rynek kapitału akcyjnego rozwijał się w przyszłości, należy poprawić wiedzę finansową inwestorów indywidualnych. ORYGINALNOŚĆ I WARTOŚĆ: Dzięki bardzo ograniczonej analizie w Azji, gdzie znajdują się drugie i trzecie co do wielkości giełdy na świecie, zidentyfikowaliśmy czynniki stojące za sukcesem japońskich ECF. Zidentyfikowanie czynników sukcesu w kraju takim jak Japonia, gdzie wielu inwestorów indywidualnych wykazuje skrajną awersję do ryzyka, dostarczy nowych informacji. Porównując powodzenie lub porażkę dwóch typów japońskich projektów ECF (projektów typu common equity i praw do nabycia akcji), mogliśmy sprawdzić wiedzę finansową indywidualnych inwestorów, biorąc pod uwagę sygnały projektu.
Słowa kluczowe: crowdfunding udziałowy, wiedza finansowa, teoria sygnalizacji, inwestorzy indywidualni, IRR, umiejętność zarządzania, inwestorzy, rynek kapitałowy, czynniki sukcesu, ryzyko
Biographical notes
Yoshiaki Nose is a professor of finance at the Graduate school of business, Doshisha University (Doshisha Business School), Japan. His area of expertise is empirical analysis of corporate finance. In recent years, he has focused on payouts, mergers and acquisitions, and entrepreneurial finance.
Chie Hosomi is a member of Doshisha Business School Network, the alumni organization of Doshisha Business School. She is also a manager of FUJIFILM Business Expert Corporation.
Authorship contribution statement
Yoshiaki Nose: Conceptualization, Funding Acquisition, Methodology, Project Administration, Validation, Writing – Original Draft, Writing – Review & Editing. Chie Hosomi: Data Curation, Formal Analysis, Software, Visualization, Writing – Original Draft.
Conflicts of interest
The authors declare no conflict of interest.
Citation (APA Style)
Nose, Y., & Hosomi , C. (2023). What makes equity crowdfunding successful in Japan? Testing the signaling and lack of financial literacy hypotheses. Journal of Entrepreneurship, Management, and Innovation, 19(4), 146-183. https://doi.org/10.7341/20231945