


Received 25 November 2022; Revised 15 February 2023; Accepted 27 February 2023.
This is an open access paper under the CC BY license (https://creativecommons.org/licenses/by/4.0/legalcode).
Mehmet Yaşar, Assistant Professor, School of Civil Aviation, Kastamonu University, Kuzeykent Mahallesi, Kastamonu Universitesi Sivil Havacılık Yüksekokulu, Kat: 2, 37150, Kastamonu-Türkiye, e-mail: This email address is being protected from spambots. You need JavaScript enabled to view it. 
Ender Gerede, Professor, Faculty of Aeronautics and Astronautics, Eskisehir Technical University, Gazipaşa Mahallesi, Eskişehir Teknik Üniversitesi, İki Eylül Kampüsü, 26555, Eskişehir-Türkiye, e-mail: This email address is being protected from spambots. You need JavaScript enabled to view it.
Abstract
PURPOSE: Firms that want to obtain an advantageous market position and a sustainable long-term competitive advantage in a competitive market place are engaged in competitive behavior in order to realize these goals. Competitive behavior is realized by competitive moves that they have made under real market conditions or by reactions (retaliation) against these moves. Those who initiate the action (Actors), those who respond to the actions (Responders) and competitive actions constitute the competitive dynamics of an industry. The results of the competitive actions carried out within the scope of competitive dynamics are monitored within the scope of market performance. The aim of this study is to reveal the factors that affect the operational and financial market performance of airline companies competing in the Turkish international airline market. METHODOLOGY: In this context, 26 airlines competing in the Turkish international airline market were evaluated in the context of rival pairs between 2009 and 2018. The analysis of the models designed in the study was carried out by panel regression analysis. FINDINGS: The findings obtained in the study show the relative market share gain of airlines is positively influenced by their firm maturity, relative size, financial resources, total number of flights, and fleet homogeneity, it is negatively impacted by their capability to deploy resources. According to research, the relative Revenue Passenger Kilometers is positively impacted by the relative size of the airlines, the same business model, and Load Factor, but negatively impacted by resource deployment capability and competing in the same alliance. While the resource allocation capability and efficiency of the airlines have a positive effect on the net result, firm maturity and total number of flights have a negative effect. It has been revealed that the resource deployment capability of airlines and efficiency of airline firm have a positive effect on financial performance, while firm maturity, the total number of flights, and slack resources have a negative effect. IMPLICATIONS: By introducing additional variables—such as fleet homogeneity, business model, strategic alliances, and codesharing – to the variables utilized in prior studies, this research is expected to add to the body of knowledge on competitive dynamics. Airlines will be guided in and before their actions in a competitive marketplace by understanding the circumstances in which they will demonstrate greater operational and financial performance than their rivals. ORIGINALITY AND VALUE: Knowing in which situations airlines will show better operational and financial performance against their competitors will guide them in and before their actions in a competitive marketplace.
Keywords: competitive dynamics, competition, strategic management, airline companies, panel data analysis, financial performance, operational performance
INTRODUCTION
Competitive dynamics is a field of research that studies all firms competing in the market and the competitive actions performed by these firms, the antecedents, and the result of these actions. Competitive dynamics, which took its place in strategic management research and where the first studies emerged in the second half of the 1980s (MacMillan et al., 1985; Bettis & Weeks, 1987; Smith et al., 1989), made important contributions to the paradigm transformation that Porter (1980; 1985) brought to strategy, as it examines the concrete, observable and measurable actions taken in the market place.
Being able to predict the actions and reactions of competitors has a positive effect on the market position and financial performance of the firm (Lim, 2013; Bou & Satorra, 2007). For this reason, firms try to catch some clues by monitoring the competitive actions of their competitors in order to improve their market performance. To capture these clues, some tools and models have been developed. The inter-firm rivalry model is one of the mentioned methods. According to this model, firms analyze the degree of overlap by comparing their resources and markets with competitors. After this analysis, it is understood which firm (or firms) is really a competitor, and which one is more confronted with, and this shapes competitive behavior. The actions and retaliations carried out within the scope of competitive behaviors also determine market performance (Hitt et al., 2016). The evaluation of the factors included in the inter-firm rivalry model among the firms will guide their competitive actions and these firms will have the chance to perform better in operational and financial terms than their competitors with the competitive actions they will take. As an illustration, if two airlines that compete with one another in multiple markets and have comparable resources decide to engage in competitive action against one another, they will do so after carefully weighing the extent to which their markets and resources overlap (Chen, 1996). These two significant aspects of competitor analysis will help them perform better in this situation.
In the studies carried out in the context of competitive dynamics, it is seen that the components of inter-firm rivalry are the subject of research in different research and contexts. In these studies, competitor analysis (Chen, 1996; Chen et al., 2007; Tsai et al., 2011; Yaşar & Gerede, 2020), factors that lead to competitive moves (Gündüz & Semerciöz, 2012; Semerciöz, 2013; Albers & Heuermann, 2013; Yaşar, 2017), competitive actions that take place directly between firms (MacMillan et al., 1985; Bettis & Weeks, 1987; Smith el al., 1991; Chen & Hambrick, 1995) and the performance that presents us with the results of these actions (Chen & Miller, 1994; Boyd & Bresser, 2008) were examined. This research aimed to reveal the factors that are decisive in the results of competitive actions of firms – in other words, market performance. The relevant performance variables consist of both airline-specific operational parameters proposed by the literature and financial parameters. Market cooperation; business models that affects the way of doing business of the company; and fleet homogeneity, which is considered to be effective on the market performance unlike the previous research, are also discussed within the scope of the research. The primary research question (RQ) in this study is given below:
RQ) What are the factors that have an impact on the relative operational
and financial performance of airline companies?
The secondary research questions (RQs) are presented below:
RQ1) What are the factors determining the relative market share gain?
RQ2) What are the factors that are effective for airlines to produce fewer/more
Revenue Passenger Kilometers (RPK) compared to their competitors?
RQ3) What are the factors that are effective for airlines to make more profit and/
or loss compared to its competitor?
In order to answer the main and sub-research questions, the scope of this research consists of the competitor pairs formed by the 26 airline companies operating with the third and fourth traffic rights in the Turkish international airline market. Panel data analyzes were performed with 650 competitor pair observations obtained with 26 airlines.
Inter-firm rivalry model
Competitive interaction was developed from the action and retaliation model, in which a firm’s competitive actions have noticeable effects on competitors and receive competitive responses from them (Abebe & Angriawan, 2014; Rindova et al., 2010; Yu & Cannella, 2007). This model states that firms are mutually interdependent and are influenced by each other’s actions and reactions (Bass & Chakrabarty, 2014; Villanueva et al., 2012). The results of the studies show that competitive interaction can have an impact on the financial performance and market position of the firm (Miller & Chen, 1996a; Ferrier, 2001; Chen et al., 2010; Ferrier et al., 2002; Ndofor et al., 2011). For example, studies show that intense competition within an industry leads to a decrease in the average profitability of competing firms (Gimeno & Woo, 1999; Sirmon et al., 2010; Ellram et al., 2013; Chang & Wu, 2014).
Firms want to achieve an advantageous market position by using their talents, competitive actions, and reactions they perform (Kor & Mahoney, 2005). Being able to predict the actions and reactions of competitors in advance has a positive effect on the market position and financial performance of the firm (Lim, 2013; Bou & Satorra, 2007). The inter-firm rivalry model (Figure 1) was developed to show how firms would predict a competitor’s behavior (Zhang et al., 2014). This model presents the sequence of activities that are commonly involved in the competition between a firm and its competitors. The sum of all firm-level competitive interactions that occur in a particular market, modeled in Figure 1, reflects the competitive dynamics in that market.
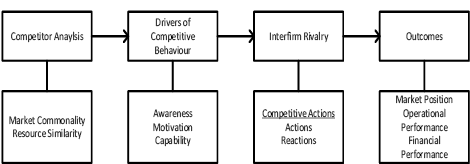
Figure 1. Inter-firm rivalry model
Source: Adapted from Hitt et al. (2016, p. 146).
Competitor analysis is the first step taken by a firm to be able to estimate the scope and nature of its competition with each competitor (Gnyawali & Madhavan, 2001). Competitor analysis is carried out, in particular, before the firm makes a decision to enter a new market, because companies need to understand the current competition and competitors in the market they want to enter (Hitt & Xu, 2016; Arregle et al., 2013). It is claimed that if firms enter a market without conducting competitor analysis, their success will decrease (Zajac & Bazerman, 1991).
Chen suggests that competitor analysis should be carried out in two dimensions. The first of these is market commonality, which shows the degree of overlap of market in which firms compete with each other at the same time. The other is resource similarity, which shows the degree of similarity of resources with those of its competitor in terms of type and quantity (Chen, 1996). Major studies have compared the fleets of airlines while looking at the degree of similarity of resources within the scope of competitor analysis. In some studies from different industries, it is seen that different resources are compared as well as fleet similarity (Pei et al., 2015). Although aircraft are seen as the most important resources for airline companies, the financial resources to obtain them, the flight crew and technical team that enable the planes to fly are among the important resources of these companies. These two dimensions of competition determine the extent to which firms are competitors. Firms with high market commonality and similar resources are direct competitors of each other. However, some studies show that such firms are wary of initiating competitive action against each other for fear of possible retaliation (Chen, 1996). The drivers of competitive behavior are the factors that influence the likelihood that a competitor will initiate competitive actions and respond to the actions of its competitors. These factors affect the intensity of the competition (Alexy et al., 2013).
After the competitor analysis is done, firms begin to understand their competitors in the market they compete in or want to enter, and this process affects their awareness and motivation to initiate or not action. If the firm’s resources are favorable, the firm’s capability can provide the initiation of competitive action (Hitt et al., 2016). These three concepts, which are also called the factors that lead to competitive behavior or the driving forces of competition, are examined under the heading of the Awareness-Motivation-Capability (AMC) perspective (Albers & Heuermann, 2013). Awareness refers to the degree to which firms are aware of the degree of interdependence and the consequences of their competitive actions (Hsieh et al., 2015). The relative size of airline companies can be seen as a factor that increases or decreases awareness. Motivation relates to the firm’s impulse to take action or react to a competitor’s move. The degree of motivation is influenced by the gains that the firm will achieve when it performs competitive action. When the firm takes action, if it thinks that it will bring a positive enough advantage for itself, its motivation and, consequently, the likelihood of initiating the action will increase (Compagni et al., 2015). Capability is related to the firm’s resources and the flexibility that these resources provide to the firm (Albers & Heuermann, 2013). Even if the firm’s awareness and motivation are high, if its resources are not suitable for starting an action, this move it wants to initiate may not give the desired results. For example, when an airline wants to enter a market that it considers profitable, or when it wants to increase the frequency in one of its existing markets, then the number of aircraft in its fleet and the number of flight and cabin crew should be sufficient.
Competitive moves and reactions between a firm and a competitor affect the performance of both firms (Cusumano et al., 2015; Alcácer et al., 2013). A competitive move is a strategic or tactical action that the firm takes to create a competitive advantage, maintain its existing advantage, or improve its market position. A competitive response is the strategic or tactical action taken by the focal firm against the competitive action of the rival firm (Hitt et al., 2016). In terms of airline companies, increasing the frequency of an existing route can be given as a tactic, and starting a new service that no airline company has done before can be given as an example of strategic action.
The purpose of competitive interaction between firms is undoubtedly to achieve competitive gains. It is clear that whether this goal is achieved or not, competitive interactions will have various outcomes for competitors (Smith et al., 2001). These are the firm’s advantageous market position and financial results. In the airline industry, it is observed that the unique performance criteria of the sector, such as operating revenues per seat-km, load factor, and revenue passenger kilometers are used (Chen & Hambrick, 1995; Miller & Chen, 1994, 1996a; 1996b). It is seen that parameters such as return on investments, net income, and return on equity (Young et al., 1996; Smith et al., 2001) and stock returns (Lee et al., 2000) are used to measure financial performance.
LITERATURE REVIEW
It is observed that the first studies in the field of competitive dynamics began in the second half of the 1980s. From these studies, MacMillan et al. (1985) examined competitor reactions to easily imitated products in the banking sector. This research was followed by a study by Bettis and Weeks (1987) in which they examined the actions and retaliations of Polaroid and Kodak, two major companies involved in the photography industry. Smith et al. (1989) discussed the factors that affect the duration of retaliation in more than one industry. Since the 1990s, competitive dynamics has become a research topic in the airline industry. From these studies, Smith et al. (1991) examined the attacks in the US airline industry and the reactions to them, Chen and Hambrick (1995) examined the role of firm size in competitive interaction. A number of long-held beliefs concerning the competitive behavior of very small enterprises in an industry were put to the test by Chen and Hambrick in 1995. Small firms tend to launch more attacks, execute them more quickly, and maintain a low profile throughout these attacks, which in some ways resemble guerilla warfare. Additionally, these firms operate better when they behave in a way that is normal for firms of their size; performance seems to suffer when these companies deviate from these norms. For the purpose of achieving specific competitive outcomes, firms interact with one another. Common performance measures, such as changes in market share (Ferrier et al., 1999), cumulative abnormal returns to shareholders (Lee et al., 2000), sales growth (Ferrier, 2000), and return on investment, have typically been used in competitive dynamics as the dependent variable (Young et al., 1996). However, a number of studies on the effects of action on performance in the airline industry employ an industry-specific performance measure – operating revenue per available seat kilometers – that takes into consideration efficiency, aircraft load factors, and revenue (Chen and Hambrick, 1995; Miller and Chen, 1994).
Chen (1996) developed the competitor analysis, which is a tool that companies in the sector can use before competitive interactions. Evans and Kessides (1996) describe the multi-market relationships of US airlines, which have to compete in more than one market at the same time, Baum and Korn (1996, 1999) also evaluated the market entry and exit of firms competing in the US airline market in the context of competitive dynamics. Young et al. (2000) examined the effects of various market relationships and a variety of resources on the industry’s competitive dynamics within the setting of the software sector. According to Silverman and Baum (2002), who connected ecological and economic studies on organizations, the degree to which a focus firm restricts alliance opportunities and raises industry carrying capacity, determines the consequences of horizontal, upward, and downward alliances of competitors. Stiroh and Strahan (2003) discovered that, as a result of competitive reallocation effects that transfer assets to better performers, the relationship between a bank’s relative performance and its subsequent gain in market share becomes substantially stronger after deregulation.
The competitor analysis developed in the mid-1990s was later given different interpretations, and Chen et al. (2007) placed the human dimension into competitor analysis with competitive tension. Tsai et al. (2011) stated that competition should also be evaluated from the perspective of the competitor. In this context, with the competitor acumen they developed, they both brought this concept to the competitive dynamics literature and offered a new tool to the sector managers that they could use in competitor analysis.
When the studies in the context of Turkey are examined, it is seen that Gündüz and Semerciöz (2012) examined the relationship between strategic innovation and competitive tension in the Turkish domestic market, and Gündüz (2013) examined the effect of competitive tension on strategic innovation decisions. Açar and Sarvan (2016) investigated the competitive actions developed by international cigarette firms in the face of public health policies and the competitive repertoires of these firms. Yaşar (2017) analyzed cross-competition involving more than one mode of transport in the context of the Ankara–Istanbul route, while Sönmez and Eroğlu (2017) discussed the characteristics of competitive moves and retaliations in the Turkish airline domestic air transport market, and Yaşar and Gerede (2020) focused on the determinants of competitive tension in the same market. Sönmez and Eroğlu (2021) developed a sector-specific typology proposal by classifying competitive actions.
The operational and financial outcomes of competitive dynamics are presented within the context of competitor pairs in this study, in contrast to earlier studies. Few studies have been discovered in the literature that discuss the consequences of the firms’ competitive behaviors in the context of rival pairs, although it is evident that the premises stated are constrained. As a result, additional factors will be incorporated into the research unlike prior studies, and more comprehensive models will be constructed. The revenue passenger kilometers variable, one of the outcome variables taken into account in the context of operational performance, has also not been found to be considered as a performance output in any research. On the other hand, it is considered that the research is distinctive from previous studies, since the impacts of the same variables on operational and financial results are analyzed concurrently.
METHODOLOGY
In the study, three models were developed to determine the factors affecting the results of competitive actions. In the first model, the factors determining the relative market share gain of airlines are examined. In the second model, revenue passenger kilometers, which is an output of operational performance, was used as a dependent variable, and factors determining the operational results of competitive actions of airlines were studied. In the last model, the net profit/loss of the airlines compared to the rival is used as the dependent variable and the factors determining the financial results of the competitive actions of the airlines are examined. Figure 2 shows an illustration that includes the adaptation of the competition model between firms to the research.
The independent variables used in the research consist of both the variables used in previous studies and the variables that will be used for the first time. Variables used for the first time in the inter-firm rivalry model (explained in detail in the next section), like strategic alliances, codeshare agreements, business models, and frequency, are being utilized for the first time.
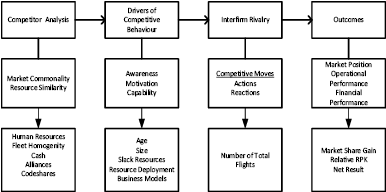
Figure 2. Integration of inter-firm rivalry model into research
Source: Authors own elaboration adapted from Hitt et al. (2016, p. 146).
For airline firms to expand and widen their flight networks, strategic alliances are crucial. By joining international alliances, airline firms have the opportunity to maintain a continuous worldwide flight network. Additionally, alliance members have access to a variety of exclusive lounges across the globe that they can utilize, and when frequent flyer programs are combined, customers flying with an alliance member airline are given benefits like priority check-in and boarding. In the light of this information, it is thought that the airline companies’ being in these alliances has an impact on financial and operational performance.
Airlines occasionally engage in both competition and collaboration. Codeshare flights are one of these methods of collaboration. Airlines may offer tickets for the same flight on codeshare flights in accordance with the arrangements they have established. As a result, it occurs in the market without the need for physical resources. It is believed that this will have an impact on operational and financial performance when a codeshare flight is made.
When examining the business models of the airlines, it becomes clear that low cost carriers provide point-to-point flights on relatively short-haul routes, whereas charter airlines fly to tourist destinations that are typically visited for vacations. The vast and varied flight network of traditional airlines, on the other hand, also offers a worldwide service. As a result, it is expected that the results of these businesses, which have various flight network configurations and cater to various market segments, may vary.
Data and variables
The variables used in the research, their abbreviations in the model and references are given in Table 1.
Table 1. Data and variables
|
Variable type |
Variable name |
Abv. |
Data used |
References |
|
DM |
Alliances |
AL |
Strategic Alliances |
Gudmundsson and Lechner (2006) |
|
DM |
Business Model |
BM |
Business Model |
Buck and Lei (2004); Gillen (2006) |
|
DM |
Codeshare |
CD |
Codeshare Agreements |
Hooper (2005) |
|
I |
Firm Maturity |
AG |
Age |
Chen et al. (2007); Tsai et al. (2011) |
|
I |
Relative Size |
ASK |
ASK |
Taneja (1989); Baum and Korn (1999); Chen and Hambrick (1995) |
|
I |
Efficiency |
LF |
Load Factor |
Dai et al. (2005); Davila and Venkatachalam (2004) |
|
I |
Slack Resources |
CR |
Current Ratio |
Young et al. (1996); Chen et al. (2007) |
|
I |
Staff |
SF |
Number of Employees |
Petrović et al. (2018); Taneja (2002) |
|
I |
Financial Resources |
CH |
Cash and equivalents |
Haleblian et al. (2012) |
|
I |
Resource Similarity |
RS |
Airline Fleets |
Chen (1996) |
|
I |
Fleet Homogenity |
FH |
Fleet Homogenity Index |
Klophaus et al. (2012) |
|
I |
Market Commonality |
MC |
O-D Pax Numbers |
Chen (1996); Baum and Korn (1999); Gimeno (1999); Tsai et al. (2011) |
|
I |
Capability |
RD |
Avg. O-D Market Share |
Tsai et al. (2011) |
|
I |
Frequency |
FQ |
Number of Flights |
Doganis (2006); Burghouwt (2007) |
|
D |
Market Share Gain |
RM |
Total Market Share |
Tsai et al. (2011) |
|
D |
Revenue Passenger Kilometer |
RPK |
RPK |
Doganis (2006); Abel (2021) |
|
D |
Net Result |
NR |
Net Profit/Loss |
Gimeno and Woo (1999); Boyd and Bresser (2008) |
Note: DM: Dummy; I: Independent; D: Dependent.
Independent variables
Within the scope of the research, the following independent variables, three of which were dummies, were used as explanatory variables:
- Strategic Alliances (AL): In order to understand whether the market performances of the airlines that cooperate while competing are affected by this situation, the strategic alliance variable was included in the research as a dummy variable. Strategic alliances were examined in three groups and firstly, it was determined whether the airline is included in a strategic alliance. Then, it was determined which global alliance the airline is in (Star Alliance, Sky Team and One World). If the rival pairs are in the same alliance, the variable will take the value of one (1), otherwise zero (0).
- Business Model (BM): In order to understand whether the business model has an effect on market performance, the business model was included in the study as a dummy variable. Business models are discussed in three groups (traditional, low cost and charter) in this research. The competitor’s business model variable is a dummy variable, and if rival pairs are performing their activities with the same business model, the variable will take the value of one (1), otherwise zero (0).
- Codeshare Agreements (CD): Code sharing agreements are important in terms of affecting competition and cooperation between airline companies (Ivaldi et al., 2022). When code sharing is done, the airline will be able to enter the relevant market by using the resources of the airline (fleet, crew, slot, etc.) without using its own physical resources (Gayle, 2008, p. 746). In this context, the codeshare agreements variable is a dummy variable and if two competitors are performing codeshare flights, the variable gets the value of one (1), otherwise zero (0).
- Firm Maturity (AG): Firm maturity is measured by expressing the time elapsed from the establishment of the airline to the present day in years. It can also be expressed as firm age. It can be said that airlines with higher maturity than their competitors are those that know the conditions of the market better, can be defined as incumbent firm for the market, and create barriers for potential competitors to enter the market (Ismail & Jenatabadi, 2014, p. 213). Based on these facts, it is thought that the age of the firm has an effect on the firm performance. This variable, which can also be expressed as age, is found by dividing the focal and the rival age of the airlines at the rival-dyad level.
- Relative Size (ASK): The available seat kilometers (ASK) value of the airline was used for the size. It is thought that the relatively larger airlines will perform better in the competitive market. The relative size variable value is obtained by proportioning the ASK of the focal and the rival firm to each other.
- Efficiency (LF): The load factor (LF) of the airlines was used for the efficiency variable. The LF is obtained by dividing the revenue passenger kilometers (RPK) value by the ASK value. It is thought that the airlines, whose LF is higher than its competitor, will perform better, because airlines operating with a high LF will be able to produce more RPK and thus they will have the opportunity to reduce their unit costs. After obtaining the LF of each airline, these values are compared to each other as a focal and rival airline on the basis of competitor pairs.
- Slack Resources (CR): The current ratio (CR) value of the firm (current assets / short-term liabilities) will be used for slack resources. It will not be remiss to say that the higher the CR, the less the cash shortage of the firm, but at the same time, the more its available resources. It is believed that more resources will provide more opportunities for competitive actions, and therefore the firm will perform better than its competitor (Chen et al., 2007, p. 109). The value of this variable is obtained by dividing the CR values of the focal and the rival firm by each other.
- Staff (SF): It is thought that human resources in firms will be effective in competitive actions and therefore in market performance. The variable obtained by the ratio of number of employees of the focal and the rival at the firm-pair level reflects the state of the human resources of the two airlines relative to each other.
- Financial Resources (CH): It is important whether the financial resources are sufficient for the firm to carry out its competitive actions (McGrath et al., 1998, p. 728). The purchase or lease of an aircraft, the development of a new service, advertising or carrying out promotional activities can be given as examples of competitive actions that require financial resources. This value is calculated by dividing the financial resources of the focal and rival firm. For the financial resources data, cash and cash equivalents of firms were used.
- Resource Similarity (RS): The formula given below is used to measure resource similarity in competitive dynamics research (Chen, 1996; Chen et al., 2007, p. 109; Tsai et al., 2011, p. 769):

where:
 : Resource similarity between firm i and j,
 : Number of aircraft of type m of firm i,
 : Number of all aircraft of the firm i,
 : Number of aircraft of type m of firm j,
 : Number of all aircraft of type m.
The resource type considered when calculating resource similarity is aircraft. It is calculated how similar the number of different types of aircraft in the fleets of airlines is. In the research, airplanes with similar range and seat capacity produced by different companies (such as the Airbus A320 and Boeing 737) were accepted as the same type of aircraft (Chen, 1996; Chen et al., 2007; Tsai et al., 2011). In other studies, only aircraft of the same type of the same company are seen as having the same resources. However, in this research, airplanes produced by different manufacturers, but with similar characteristics, are also defined as the same source, because it is thought that seeing such aircraft as different resources, despite having similar characteristics, will lead to erroneous results.
- Fleet Homogeneity (FH): Fleet homogeneity refers to how many of the fleets of airlines consist of the same type and characteristics of aircraft. If all aircraft of an airline are of the same type and characteristics, the fleet homogeneity takes the value of one (1). As the diversity within the fleet increases, this value decreases (Klophaus et al., 2012, p. 55).
- Market Commonality (MC): Market commonality gives the degree of overlap of the common markets in all markets in which the firms operate from the point of view of the focal company. Market commonality, which is the independent variable, is asymmetric. When calculating, an assessment is made separately from the eyes of each company. The market commonality is calculated as follows (Chen, 1996, p.118):
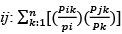
where:
Mij: Market commonality between firm i and j,
Pik: The number of passengers carried by the airline i on route k or on the airport pair market (route),
Pi: Total number of passengers carried by airline i on all routes,
Pjk: The number of passengers carried by airline j on k route,
Pk: The number of passengers carried by all airline operators on the k route.
Market commonality is calculated separately for all competitors by considering each firm as a focal firm. A total of 26x25=650 competitor pairs were obtained for the 26 airline operators included in the study.
- Capability (RD): To measure resource deployment capability, the logarithm of the ratio between the focal firm’s average, endpoint, market share and the competitor’s average, endpoint, market share is taken. The ability of an airline to transfer resources has been evaluated by looking at the degree to which it is dominant or how active it is compared to a certain competitor at the start and destination points (Tsai et al., 2011, p. 770). An airline with a large number of passengers (active) at the origin–destination points of a flight route can allocate more resources to that route to compete with rival airlines on that point (Borenstein, 1989; Gimeno, 1999). It is thought that airlines that transfer their resources more comfortably will show better market performance.
- Frequency (FQ): The total number of flights refers to the number of all flights that the airline has made in one calendar year. This variable, calculated on the basis of competitor pairs, also indicates how much product the two competitors offer to the market relative to each other. In this context, it is thought that an airline operating more flights than its competitors will perform better, because the number of flights reduces the total travel time included in the tariff-based components of the airline product. The fact is that short travel time is important for time-sensitive passengers (Doganis, 2006, p. 87).
Dependent variables
There are three separate dependent variables related to each model. These are relative market share gain and RPK, representing operational performance and net result representing financial performance.
- Relative Market Share Gain (RM): Relative market share gain shows the increase or decrease in the market share of the airline compared to its competitor compared to the previous year. To calculate the relative market share gain, the change in the airline’s market shares is logarithmically divided by the competitor’s market share value. In the following formula, the equation for calculating the variable in question is given (Tsai et al., 2011, p. 769).
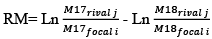
The formula reflects the difference between the market share gap in 2017 and the market share decimation in 2018. When the market share gap is smaller in 2018 than in 2017, a positive value emerges and shows that the focal firm has gained more market share compared to the competitor. A negative value represents the opposite situation.
- Revenue Passenger Kilometers (RPK): The revenue passenger kilometers value is obtained by multiplying the number of passengers carried by airline operators for tickets and how far they are transported (Gerede, 2015, p. 32). One of the most important consequences of the competitive actions of airlines and the competitive dynamics of the industry is the amount of production performed by the airline. In this context, another dependent variable of the research is the revenue passenger kilometer, which we can evaluate as the output of operational performance. This variable is obtained by dividing the paid passenger kilometer values of the airlines on the basis of the competitor pair.
- Net Result (NR): Net profit/loss is obtained from net income by subtracting the cost of goods sold, operating expenses, depreciation it allocates, interest it pays, and taxes (Glew, 2017). Profitability, which is important for the sustainability of the firm, is an important component of performance, which is the output of the inter-firm rivalry model. In this context, another dependent variable of the research is the net result, which we can evaluate as the output of financial performance. This variable is obtained by subtracting the profit/loss situations of the airlines on the basis of the rival pair. Thus, the relative profitability levels of airlines are revealed at the end of the relevant calendar year.
Data set and models
This study aims to examine the factors that determine the results of competitive actions and panel data analysis was used to reveal these factors. The models developed within the scope of the study are as follows:
Model 1: RM𝑖𝑡= 𝛽0 + 𝛽1ASK𝑖𝑡 + 𝛽2LF𝑖𝑡 + 𝛽3AG𝑖𝑡 + 𝛽4OD𝑖𝑡 + 𝛽5MC𝑖𝑡 + 𝛽6RS𝑖𝑡 + 𝛽7FH𝑖𝑡 + 𝛽8DummyBM𝑖𝑡 + 𝛽9DummyAL𝑖𝑡 + 𝛽10DummyCD𝑖𝑡 + 𝛽11CR𝑖𝑡 + 𝛽12FQ𝑖𝑡 + 𝛽13CH𝑖𝑡 + 𝛽14SF𝑖𝑡 + 𝜀𝑖𝑡 (4)
Model 2: RPK𝑖𝑡= 𝛽0 + 𝛽1ASK𝑖𝑡 + 𝛽2LF𝑖𝑡 + 𝛽3AG𝑖𝑡 + 𝛽4OD𝑖𝑡 + 𝛽5MC𝑖𝑡 + 𝛽6RS𝑖𝑡 + 𝛽7FH𝑖𝑡 + 𝛽8DummyBM𝑖𝑡 + 𝛽9DummyAL𝑖𝑡 + 𝛽10DummyCD𝑖𝑡 + 𝛽11CR𝑖𝑡 + 𝛽12FQ𝑖𝑡 + 𝛽13CH𝑖𝑡 + 𝛽14SF𝑖𝑡 + 𝜀𝑖𝑡 (5)
Model 3: NR𝑖𝑡= 𝛽0 + 𝛽1ASK𝑖𝑡 + 𝛽2LF𝑖𝑡 + 𝛽3AG𝑖𝑡 + 𝛽4OD𝑖𝑡 + 𝛽5MC𝑖𝑡 + 𝛽6RS𝑖𝑡 + 𝛽7FH𝑖𝑡 + 𝛽8DummyBM𝑖𝑡 + 𝛽9DummyAL𝑖𝑡 + 𝛽10DummyCD𝑖𝑡 + 𝛽11CR𝑖𝑡 + 𝛽12FQ𝑖𝑡 + 𝛽13CH𝑖𝑡 + 𝛽14SF𝑖𝑡 + 𝜀𝑖𝑡 (6)
The models developed to determine the factors affecting the results of competitive actions are seen in equations (4), (5) and (6) above. Model 1 and Model 2, respectively, aimed to reveal the relative market share gain (RM) and revenue passenger kilometer (RPK), while Model 3 aimed to reveal the factors determining net profit/loss (NR).
This study aims to explore the factors that determine the results of competitive actions. The study examines 26 international airlines that operated in Turkish international airline market between 2009 and 2018 and whose data were available (In Appendix 1, a list of airlines is provided). These airlines use the third and fourth traffic rights in the Turkish international market to transport passenger, cargo, and mail. However, these are not the only areas in which they operate. Since the research is carried out at the level of competitor pairs, competitor pairs formed by international companies (for example, Lufthansa and British Airways) that organize flights to Turkey also include different international markets within the scope of the research. These 26 airline companies are among the top 50 in terms of passenger ranking in the Turkish international airline market in all of the determined years and their data can be accessed. In addition, the sum of RPK values constitutes 20 percent of the global RPK. Among the reasons for limiting the research data to 2018 is the accessibility of the data. Another reason is the Covid-19 pandemic, which started at the end of 2019 and affected the whole world in 2020, causing flights to be stopped in many countries.
The research data were obtained from the annual activity and financial reports of airlines and FlightGlobal, OAG, Eurostata, and EMIS Store. Panel data analysis was used as a method with STATA-13. In panel data analysis, panel data models are created using horizontal cross-sectional data with a time dimension. In these models, economic or financial relations are estimated with the help of panel data (Yerdelen Tatoğlu, 2016). The panel data equation is an equation in which the cross-sectional units i (i=1,...,N), the change of t with respect to time (t=1,...,N), the dependent variable Y and the independent variable(s) are shown as X. 𝑌𝑖𝑡=𝛼𝑖𝑡+𝛽𝑖𝑡𝑋𝑖𝑡+Ɛ𝑖𝑡 here Ɛ𝑖𝑡 shows error terms. Before the panel data analysis, the horizontal cross-sectional dependence and stationarity of the series were determined. In the next stage, some preliminary tests were carried out to determine which panel data model is suitable. After selecting the appropriate panel data model, variance and autocorrelation tests were performed.
RESULTS AND DISCUSSION
In Table 2, the Pearson-correlation matrix, which provides information about the relationship between the independent variables, is given.
Table 2. Correlation matrix of independent variables
|
AG |
ASK |
AL |
BM |
CD |
CH |
CR |
FH |
FQ |
LF |
OD |
MC |
RS |
SF |
|
|
AG |
1 |
|||||||||||||
|
ASK |
0.362 |
1 |
||||||||||||
|
AL |
-0.067 |
-0.041 |
1 |
|||||||||||
|
BM |
-0.107 |
-0.008 |
0.283 |
1 |
||||||||||
|
CD |
-0.057 |
-0.021 |
0.722 |
0.291 |
1 |
|||||||||
|
CH |
0.003 |
0.094 |
-0.015 |
-0.028 |
-0.014 |
1 |
||||||||
|
CR |
-0.200 |
-0.103 |
-0.019 |
-0.035 |
-0.029 |
-0.009 |
1 |
|||||||
|
FH |
-0.385 |
-0.279 |
-0.015 |
-0.059 |
-0.008 |
-0.046 |
0.130 |
1 |
||||||
|
FQ |
0.163 |
0.324 |
-0.033 |
-0.095 |
-0.027 |
0.012 |
-0.032 |
-0.094 |
1 |
|||||
|
LF |
-0.083 |
0.148 |
-0.007 |
-0.027 |
-0.004 |
0.075 |
-0.018 |
0.161 |
0.056 |
1 |
||||
|
OD |
0.435 |
0.591 |
-2.02E |
0.002 |
-0.008 |
0.075 |
-0.106 |
-0.366 |
0.364 |
0.168 |
1 |
|||
|
MC |
0.018 |
0.043 |
0.008 |
-0.055 |
-0.005 |
-0.063 |
0.002 |
-0.050 |
0.003 |
0.025 |
0.088 |
1 |
||
|
RS |
-0.226 |
-0.266 |
0.120 |
0.167 |
0.143 |
-0.043 |
0.067 |
0.209 |
-0.118 |
-0.112 |
-0.446 |
-0.120 |
1 |
|
|
SF |
0.412 |
0.840 |
-0.050 |
-0.099 |
-0.037 |
0.130 |
-0.143 |
-0.302 |
0.431 |
0.059 |
0.550 |
0.050 |
-0.240 |
1 |
Table 2 shows the Pearson correlation matrix between the independent variables. The presence of a high correlation (over 0.80) between the independent variables in the regression model causes the problem of multicollinearity. When the correlation matrix of the independent variables is examined, it is seen that the correlation coefficients between the variables are decisively below the critical value. For this reason, the problem of multi-collinearity (multiple linear correlations) is not seen in the data set formed by independent variables.
It should be also decided which model will be appropriate to use among the Classical Model, Fixed Effects Model and Random Effects Model for the series. In this context, the F-test to test the validity of the classical model, in other words the presence of unit and/or time effects, the Breusch-Pagan LM test to test the compatibility of the classical model with the random effects model, and the Hausman test was used to choose between fixed effects and random effects models. The results of these tests are given in Table 3.
Table 3. Model identification test results
|
Models |
F-Test |
LM Test |
Hausman |
Model used |
|||
|
Stat. |
Prob. |
Stat. |
Prob. |
Stat. |
Prob. |
||
|
Model 1 |
0.56 |
0.8310 |
309.78 |
1.000 |
4.92 |
0.9351 |
Random-Effects |
|
Model 2 |
7.73 |
0.0000 |
39.36 |
0.000 |
N/A |
N/A |
Classical Model |
|
Model 3 |
9.6476 |
0.9624 |
943.31 |
1.000 |
2.95 |
0.9914 |
Random-Effects |
Source: Authors own elaboration
The random effects model is considered suitable for Models 1 and 3. It has been revealed that the classic model is suitable for Model 2. Table 4 shows the test results for heteroscedasticity.
According to the information in Table 4, the heteroscedasticity in Models 1 and 3 could not be calculated. In Model 2, the H0 hypothesis is rejected. This shows that there is a heteroscedasticity in the context of Model 2. Table 5 shows the autocorrelation test results.
Table 4. Heteroscedasticity test results
|
Models |
Test |
Test hypothesis |
Stat. |
Prob. |
Decision |
|
Model 1 |
W0 |
No heteroscedasticity |
Heteroscedasticity cannot be calculated. |
||
|
W50 |
|||||
|
W10 |
|||||
|
Model 2 |
BP/CW Chi2(1) |
No heteroscedasticity |
43041.84 |
0.0000 |
H0 Rejected |
|
White Testi |
1557.38 |
0.0000 |
H0 Rejected |
||
|
Cameron and Trivedi’s decomposition of IM-test |
1557.38 |
0.0000 |
H0 Rejected |
||
|
Model 3 |
W0 |
No heteroscedasticity |
Heteroscedasticity cannot be calculated. |
||
|
W50 |
|||||
|
W10 |
|||||
Table 5 shows the results of the tests carried out to test the autocorrelation of Model 1 and Model 3 estimated using the random effects model. These tests are Narendranathan’s DW autocorrelation test, and Baltagi and Wu’s LBI autocorrelation test. Although no critical value is specified in the literature for DW and LBI autocorrelation tests, the fact that the statistical values of DW and LBI are less than 2 indicates the existence of autocorrelation (Gündüz & Duyar, 2018; Kiraci & Aydin, 2018). The test statistics show that the values obtained in both tests are less than 2. This shows that there is autocorrelation in Models 1 and 3. The results of the Wooldridge test for classical models show that the H0 hypothesis, which established that there is no autocorrelation, is rejected. For this reason, it is seen that there is autocorrelation in Model 2 as well.
Table 5. Autocorrelation Test Results for Classical and Random-Effects Model
|
Models |
Test |
Stat. |
Prob. |
Decision |
|
Model 1 |
Baltagi-Wu LBI |
1.9693452 |
- |
- |
|
Durbin-Watson |
1.3027593 |
- |
- |
|
|
Model 2 |
Wooldridge test |
50.824 |
0.0000 |
H0 Rejected |
|
Model 3 |
Baltagi-Wu LBI |
1.9220193 |
- |
- |
|
Durbin-Watson |
1.6410302 |
- |
- |
In the study, it is seen that there are heteroscedasticity and autocorrelation problems for all three models estimated using the classical model and the random effects model. Therefore, modified standard error terms should be obtained for all three models. The method of Driscoll and Kraay (1998) makes a change such as Newey–West for the cross-sectional averaged series. Modified standard error estimates ensure the consistency of matrix estimators regardless of the cross-sectional size N (even N→∞). The method of Driscoll and Kraay (1998) was developed as an alternative to the Parks–Kmenta or PCSE approaches, which are particularly weak when the cross-sectional size of microeconomic panels is large and produce consistency, covariance, matrix estimators only when the time dimension T is large. In this method, consistency is ensured even if N is infinite. On the other hand, it is resistant to the most general spatial and periodic correlation forms of standard errors obtained from the predicted covariance matrix (Driscoll & Kraay, 1998). In order to obtain the robust standard errors of Driscoll and Kraay in the models, the modification of Driscoll and Kraay (1998) was used. Table 6 shows the robust estimator results of Model 1.
Table 6. Driscoll–Kraay robust estimator results (Model-1)
|
Variable |
Coefficient |
Robust Std.Err |
z |
P>|z| |
95% Conf. Interval |
|
|
AG |
0.0083844 |
0.0012631 |
6.64 |
0.000 |
0.0059088 |
0.01086 |
|
ASK |
0.0052747 |
0.0014591 |
3.62 |
0.000 |
0.0024149 |
0.0081345 |
|
AL |
0.0112239 |
0.0180333 |
0.62 |
0.534 |
-0.0241207 |
0.0465684 |
|
BM |
0.0042785 |
0.0075627 |
0.57 |
0.572 |
-0.0105441 |
0.0191011 |
|
CD |
-0.005295 |
0.0159425 |
-0.33 |
0.740 |
-0.0365416 |
0.0259517 |
|
CH |
-3.07e-06 |
3.44e-06 |
-0.89 |
0.373 |
-9.82e-06 |
3.68e-06 |
|
CR |
0.0214228 |
0.0048386 |
4.43 |
0.000 |
0.0119394 |
0.0309062 |
|
FH |
0.0812213 |
0.0060218 |
13.49 |
0.000 |
0.0694189 |
0.0930238 |
|
FQ |
0.0002761 |
0.0001024 |
2.70 |
0.007 |
0.0000754 |
0.0004767 |
|
LF |
-0.0383991 |
0.0354279 |
-1.08 |
0.278 |
-0.1078365 |
0.0310382 |
|
MC |
0.0990001 |
0.1113794 |
0.89 |
0.374 |
-0.1192995 |
0.3172997 |
|
OD |
-0.0121935 |
0.0064418 |
-1.89 |
0.058 |
-0.0248193 |
0.0004322 |
|
RS |
-0.0221734 |
0.09773 |
-0.23 |
0.821 |
-0.2137206 |
0.1693739 |
|
SF |
-0.0041503 |
0.000745 |
-5.57 |
0.000 |
-0.0056105 |
-0.0026901 |
|
constant |
-0.1534549 |
0.0709083 |
-2.16 |
0.030 |
-0.2924326 |
-0.0144772 |
|
Observations = 6500 |
Wald χ2(14) = 302.50 |
R² = 0.2550 (within group) |
||||
|
Number of groups = 650 |
Prob > χ2 = 0.0000 |
|||||
Table 6 shows the results of the robust estimation of Model 1, in which relative market share gain is used as a dependent variable. According to the results of the random effects model, in which the factors determining the relative market share gain are examined, the firm maturity, relative size, financial resources, total number of flights and fleet homogeneity of the airlines positively affect the relative market share gain at the 1% significance level. The resource deployment capability of the airline has a negative effect at the level of 5%, and the number of employees has also a negative effect at the level of 1% significance. There was no significant relationship found between the other independent variables of the research and the relative market share gain.
Relative market share gain, which is the dependent variable of Model 1, is a concept that represents the increase or decrease in market share relative to the competitor, and is considered as a result of the inter-firm rivalry model. When an evaluation is made about the statistical results of Model 1, it has been revealed that airlines that are older than their competitors, have more capacity to offer to the market, have more cash resources, fly more and have a homogeneous fleet show better market performance than their competitors. On the other hand, it has been revealed that the relative market share gain of airlines with higher resource deployment capability and having more employees than their competitors is lower. Incumbent firms sometimes exhibit predatory behaviors in order to prevent their competitors from entering the market and to protect their market positions (Hanlon, 2007). They can do this both by price moves and by increasing their market capacity to such an extent that their competitors who want to enter the market cannot increase it (Hanlon, 2007). In order to increase the frequency, as mentioned earlier, it is necessary to offer more flights to the market, in other words, increase the capacity. This increase in capacity brings with it an increase in ASK, which reveals the relative size of the firm. When predatory behaviors are exhibited, it is thought that the operational performance of airlines will increase due to the above reasons. In this context, the positive relationship between the firm maturity, the total number of flights, and relative size of the airlines revealed by the research findings and the relative market share gain, coincides with the explanations mentioned above. In previous studies, it was seen that some of the similar factors that were thought to be effective on the difference between the market shares of the competitors produced similar results to this research (Tsai et al., 2011), while some of them had different findings from this research (Chen et al., 2007). For example, contrary to this research, Tsai et al. revealed that the age of the airline has a negative effect on the relative market share gain. However, no significant effect of relative size was observed in the same study. Gündüz and Semerciöz (2012) also revealed in their research on the Turkish domestic airline market that the structural tension measured by market partnership has a negative effect on the volume of moves. Yaşar and Gerede (2020), in their research on the Turkish domestic airline market, revealed that the high level of market commonality increases the tension between the competitors. The effects of market commonality on action volume and competitive tension were not obtained in this research and no significant effect on performance was observed.
Another factor that has been shown to have an impact on the relative market share gain is the level of cash resources owned by the firm. From the AMC perspective, it is not enough for firms to be aware of their environment and be motivated to initiate action or retaliate. At the same time, they must have the necessary ability to initiate or respond to the move (Smith et al., 2001). From the point of view of airlines, the element that determines the capability is the aircraft, which is the most important part of the operational processes of airlines. Airlines need money to buy or lease planes. In this context, it can be said that airlines with sufficient financial resources can use this to strengthen their fleets and thus realize competitive moves that will increase operational performance. In this context, the positive relationship between the cash resources of the firms and the relative market share gain revealed by the research findings coincides with the explanations mentioned above.
It is among the findings obtained in the research that the operational performance of the airlines, which have a more homogeneous fleet than their competitors, is higher decisively compared to their competitors. Airlines operating with a more homogeneous fleet are able to respond more quickly to operational changes (Bélanger et al., 2006). For example, if an aircraft cannot be dispatched to the flight due to a technical failure, an airline with a high fleet homogeneity can swap an aircraft that is available and has similar characteristics. Thus, an airline company, which can respond quickly to changes, is less likely to encounter problems such as delays and flight cancellations that will disrupt operational processes. In the research, it has been revealed that fleet homogeneity has a positive effect on operational performance. It is seen that the above-mentioned elements and the research findings are consistent.
The average market share of the airlines in all destinations represents the resource deployment capability. Airlines with a high ability to transfer resources can transfer their resources to other markets more easily (Tsai et al., 2011). For capacity-building activities such as frequency increase and new route opening, not only aircraft are needed, but also the flight crew and cabin crew to operate them. This will also bring an increase in the number of employees. The findings revealed in the research contradict the elements mentioned above. This may be re-evaluated in future research.
Table 7 shows the robust estimation results of Model 2, in which the relative revenue passenger kilometer is used as a dependent variable.
According to the results of the pooled classical model, in which the factors determining the revenue passenger kilometer (RPK) value were examined, it was found that the relative sizes of airlines, the same business model and the load factor (LF) had a positive effect on RPK at the level of 1%, and the total number of flights at the level of 5% significance. On the other hand, resources deployment capability and competing in the same strategic alliance has a negative impact on the RPK at the level of 5% significance. There was no significant relationship found between the other independent variables of the research and the relative RPK.
Table 7. Driscoll–Kraay Robust Estimator Results (Model-2)
|
Variable |
Coefficient |
Drisc/Kraay Std. Err |
t |
P>|t| |
95% Conf Interval |
|
|
AG |
0.0418792 |
0.0296404 |
1.41 |
0.191 |
-0.025172 |
0.1089304 |
|
ASK |
1.036315 |
0.049036 |
21.13 |
0.000 |
0.9253875 |
1.147242 |
|
AL |
-0.2222317 |
0.1008752 |
-2.20 |
0.055 |
-0.4504272 |
0.0059639 |
|
BM |
0.444232 |
0.0746739 |
5.95 |
0.000 |
0.275308 |
0.613156 |
|
CD |
0.0896745 |
0.0506372 |
1.77 |
0.110 |
-0.0248748 |
0.2042238 |
|
CH |
-0.0000109 |
9.79e-06 |
-1.11 |
0.295 |
-0.000033 |
0.0000113 |
|
CR |
0.0247182 |
0.0304271 |
0.81 |
0.438 |
-0.0441126 |
0.093549 |
|
FH |
0.0638744 |
0.0569024 |
1.12 |
0.291 |
-0.0648478 |
0.1925966 |
|
FQ |
0.0038163 |
0.0019666 |
1.94 |
0.084 |
-0.0006325 |
0.008265 |
|
LF |
4.495644 |
0.6599499 |
6.81 |
0.000 |
3.002733 |
5.988554 |
|
MC |
1.089396 |
1.079922 |
1.01 |
0.339 |
-1.353558 |
353.235 |
|
OD |
-0.3255157 |
0.1177383 |
-2.76 |
0.022 |
-0.5918582 |
-0.0591731 |
|
RS |
0.2807676 |
0.7243778 |
0.39 |
0.707 |
-1.357889 |
1.919424 |
|
SF |
0.0233175 |
0.0176742 |
1.32 |
0.220 |
-0.0166644 |
0.0632995 |
|
_cons |
-5.605504 |
1.308348 |
-4.28 |
0.002 |
-8.565192 |
-2.645816 |
|
Observations= 6500 |
F( 14, 9) = 190601.96 |
R² = 0.9780 |
||||
|
Number of groups = 650 |
Prob > F = 0.0000 |
Max Lag = 2 |
||||
The RPK value, which is the dependent variable of Model 2, is a variable that represents the operational performance of airlines, and is considered as a result of the inter-firm rivalry model. When an evaluation was made regarding the statistical results of Model 2, it was revealed that the airlines that offer more capacity to the market than their competitors, and make more flights and have a high LF compared to their competitors, show better market performance compared to their competitors. On the other hand, it has been revealed that airline companies with a high resource transfer capability, and who are in the same strategic alliance, have lower RPK values than their competitors and there is an inverse relationship between operational performances. The available seat kilometers (ASK), the number of flights, and the high LF also increase the RPK value. Airlines that offer more capacity to the market can do so by increasing the frequency of flights with high-capacity aircraft or by organizing flights on long-haul routes (Doganis, 2005). Increasing capacity alone is not effective in increasing RPK. It is also necessary to adapt the existing capacity to the demand by making the airline product components appropriate to the dynamics of the market (Hsu & Wen, 2003). However, when airlines want to achieve a higher RPK, increasing the capacity they offer to the market will prepare the ground for this. In line with this information, it was seen that the positive relationship between RPK, which is the other operational performance parameter of the research, and relative size, making more flights than its competitor and keeping LF high, coincides with the aforementioned situations. On the other hand, fleet homogeneity also has a positive impact on operational performance. As in the relative market share gain, it was found that the airline companies that produce more RPK compared to competitors have a more homogeneous fleet compared to their competitors. The factors that are effective in the formation of this situation are similar to the elements in the relative market share gain and the research findings coincide with these elements. There is also a negative relationship between the ability to transfer resources, as well as in the relative market share gain. This relationship is in the opposite direction of expectation and can be re-evaluated in different contexts in subsequent research.
Table 8. Driscoll–Kraay robust estimator results (Model-3)
|
Variable |
Coefficient |
Robust Std.Err |
z |
P>|z| |
95% Conf. Interval |
|
|
AG |
-13.80655 |
4.950336 |
-2.79 |
0.005 |
-23.50903 |
-4.104073 |
|
ASK |
-0.0235798 |
3.310294 |
-0.01 |
0.994 |
-6.511636 |
6.464477 |
|
AL |
1.145664 |
117.7173 |
0.01 |
0.992 |
-229.5759 |
231.8673 |
|
BM |
-32.43057 |
37.90279 |
-0.86 |
0.392 |
-106.7187 |
41.85753 |
|
CD |
-14.23382 |
68.73348 |
-0.21 |
0.836 |
-148.949 |
120.4813 |
|
CH |
-0.0011187 |
0.0018641 |
-0.60 |
0.548 |
-0.0047724 |
0.0025349 |
|
CR |
-20.99196 |
11.29192 |
-1.86 |
0.063 |
-43.12372 |
1.139788 |
|
FH |
-25.17698 |
20.86501 |
-1.21 |
0.228 |
-66.07164 |
15.71769 |
|
FQ |
-1.851808 |
0.5514201 |
-3.36 |
0.001 |
-2.932571 |
-0.771044 |
|
LF |
625.8482 |
76.25133 |
3.36 |
0.000 |
476.3984 |
775.2981 |
|
MC |
4.21976 |
71.32029 |
0.06 |
0.953 |
-135.5654 |
144.005 |
|
OD |
194.761 |
30.0868 |
6.47 |
0.000 |
135.792 |
253.7301 |
|
RS |
241.5085 |
473.9993 |
0.51 |
0.610 |
-687.5131 |
1170.53 |
|
SF |
-3.16.2252 |
2.264821 |
-1.40 |
0.163 |
-7.601218 |
1.276715 |
|
constant |
-512.9811 |
94.21227 |
-5.44 |
0.000 |
-697.6338 |
-328.3285 |
|
Observations = 6500 |
Wald χ2(14) = 154.18 |
R² = 0.2036 |
||||
|
Number of groups = 650 |
Prob > χ2 = 0.0000 |
|||||
Table 8 shows the robust estimation results of Model 3, in which net result is used as a dependent variable. The results of the random effects model show that the (resource deployment) capability and efficiency of airlines have a positive effect on the net result at the level of 1% significance. On the other hand, firm maturity and the total number of flights have a negative effect at the level of 1% significance. Slack resources of the airline have a negative impact at the significance level of 5%. There was no significant relationship found between the other independent variables of the research and the net result.
Net result, which is the dependent variable of Model 3, represents the financial performance of airlines. It has been revealed that airlines with less firm maturity and slack resources than their competitors, which make fewer flights than their competitors and have a higher resource transfer ability and LF, have better financial performance than their competitors. It is observed that the financial performance of airlines with a high LF is better. It was argued that capacity expansion alone is not a sufficient factor in achieving an advantageous market position. At the same time, it is necessary to fill the increased capacity. This may become possible by arranging the service delivery (product) components of the airlines according to their market positions. The positive effect of the high LF revealed within the scope of the research on financial performance compared to the competitor supports the above-mentioned situation. Another element that has a positive impact on financial performance is the ability to transfer resources. Airlines with a high market share in their final destinations can transfer their resources more easily than their competitors. It is thought that having a higher market share compared to competitors will bring better financial performance and this situation coincides with the research findings. There are also variables that have a negative impact on financial performance. Of these, slack resources are represented in the current ratio (CR) and they represent the resources that the firm has, but does not use. It is thought that a firm with a high CR compared to its competitor will actually show better financial performance, but the opposite situation has emerged in the research. In the occurrence of this situation, the idea that the resources that the firm keeps on the side but does not use are idle and this may reduce performance may be effective. Another variable that has a negative impact on financial performance is the total number of flights. The total number of flights is an element that increases the capacity of the airlines. If the airline can meet the capacity with the demand, its efficiency will increase and it will reduce its unit costs in this way (Doganis, 2005; Doganis, 2006). In the opposite case, with the decrease in the LF, productivity will decrease, unit costs will increase and financial performance will be negatively affected. The findings of the study support the inverse relationship between the number of flights and financial performance.
CONCLUSIONS
It is important for firms to predict the moves or retaliation from their competitors in gaining an advantageous market position. In this context, an inter-firm rivalry model has been developed that firms can use to understand how to predict a competitor’s behavior and to reduce the associated uncertainty. In this context, the factors that have an impact on operational and financial performance, which represent the performance that is the output of the inter-firm rivalry model, have been revealed in the research. The findings obtained in the study show that firm maturity, relative size, slack resources, fleet homogeneity, and the total number of flights have a positive effect on operational performance, while the human resources and resource deployment capability of the firm has a negative effect. On the other hand, it has been revealed that the capabilities and efficiencies of airlines have a positive effect on financial performance, while firm maturity, the total number of flights, and slack resources all have a negative effect.
Airlines whose establishment date is older than their competitors had the opportunity to enter the market earlier than newer ones. When airlines that were established later want to enter the market of airlines with higher maturity, incumbent firms may show predatory behaviors to their competitors in order not to lose their current market position. Predatory behavior can occur in various forms. Of these, price reduction is more convenient to apply than other moves, but it is seen as an action that harms the firm when it is constantly applied, because constantly realizing the mutual price reduction move may lead to prices falling below costs after a while. In addition, in tightly regulated markets, airlines may not be able to regulate their prices as they wish. For this reason, predatory behavior is not limited only to price reductions. On the other hand, institutions responsible for maintaining competition in free markets can more easily prove predatory behavior on price. Since frequency is an important determinant of demand, airline companies can also use flight frequencies as a barrier to market entry. In this context, the frequency and thus capacity increase, which comes with market maturity and can only be realized with the permission of the resources, increase the operational performance of the airlines. The AMC perspective suggests that firms that are aware of what is happening in the market in terms of initiating competitive action or retaliation, have the necessary motivation to take competitive action, and have the necessary ability to initiate moves that can take competitive action. The findings obtained in the research support the propositions put forward by the AMC perspective.
The Turkish market was the scope of the research. It is obvious that every market has unique requirements for how an organization should operate. There is talk of a form of universalism more and more, yet each market has a unique operating culture, which influences the culture of the firms that operate on it. Even if the research focuses on the competitive dynamics of the airlines in the Turkish international airline market, when we take into account the airline companies’ primary regions of operation, we may speak about the generalizability of the research findings.
It is thought that this research will contribute to the competitive dynamics literature in aspects such as the context, the form of analysis, and the differentiation of the variables used in previous research by adding new variables and obtaining models that are more comprehensive. Strategic alliances are essential for airline companies to grow and diversify their route networks. Joining multinational alliances gives airline companies the chance to keep up a continuous global flight network. This research shows that the participation of airline firms in these alliances have an effect on their operational results. Sometimes airlines work together and other times they compete. One of these forms of cooperation is the use of codeshare flights. According to the agreements they have created, airlines may offer tickets for the same flight on codeshare flights. No discernible impact of code sharing on operational and financial performance was seen in this study. Future research should revisit this impact using different contexts and datasets. When comparing the different airlines’ business models, it is evident that low cost carriers offer point-to-point flights on relatively short-haul routes while charter airlines travel to popular tourist locations that are often visited on vacations. Traditional airlines, on the other hand, offer worldwide service through their extensive and diverse flight networks. This study demonstrates how using the same business model might affect an airline’s operational outcomes.
Knowing in which situations airlines will show better operational and financial performance against their competitors will guide them in and before their actions in a competitive marketplace. For this reason, it is recommended that managers analyze their competitive interaction in the context of dimensions such as source and market overlap, competitive environment, the way their competitors do business, and other airlines with which they cooperate.
There are also various limitations to this study. Firstly, only 26 airline companies are included in the study. This constraint was effectively created by the fact that the research was based on competitor pairs and equated to 650 observations on the basis of 26 competitor pairs. The number of observations will grow too large as the number of rival increases, and as 26 airline operators account for a sizable portion of the market, the airline industry is constrained to the number in question. The years that were covered by the research are yet another limitation. The study spans the ten-year period between 2009 and 2018. The data set’s accessibility and Covid-19, which began in 2019 and spread globally in 2020, both played significant roles in the formation of this situation, because most of the airline firms had to stop their operations during the pandemic. It is advised that future studies look into the market’s competitive environment following the Covid-19 outbreak, as well as its impacts and those of the most recent Ukraine–Russian war.
In future research, the inter-firm rivalry model can be expanded by including different variables in the models. In addition, by collecting primary data, more in-depth information on the causes of the occurrence of these effects can be obtained. In addition, it is recommended to examine the mediating role of competitive moves in the relationship between the antecedents and performance in the inter-firm competition model in future research and to expand the research in this direction.
References
Abebe, M. A., & Angriawan, A. (2014). Organizational and competitive influences of exploration and exploitation activities in small firms. Journal of Business Research, 67(3), 339-345. http://dx.doi.org/10.1016/j.jbusres.2013.01.015
Abel, L. F. (2021). Competitive dynamics of air transport in Brazil: 2008-2014. Clube de Autores, Sao Paulo.
Açar, A., & Sarvan, E. F. D. (2016). Halk sağlığı politikaları karşısında uluslararası sigara firmalarının rekabetçi dinamikleri. Yönetim Araştırmaları Dergisi, 13(1-2), 68-117.
Albers, S., & Heuermann, C. (2013). Competitive dynamics across industries: An analysis of inter-industry competition in German passenger transportation. Schmalenbach Business Review, 65(4), 431-453. http://dx.doi.org/10.1007/BF03396865
Alcácer, J., Dezső, C. L., & Zhao, M. (2013). Firm rivalry, knowledge accumulation, and MNE location choices. Journal of International Business Studies, 44(5), 504-520. http://dx.doi.org/10.1057/jibs.2013.18
Alexy, O., George, G., & Salter, A. J. (2013). Cui bono? The selective revealing of knowledge and its implications for innovative activity. Academy of Management Review, 38(2), 270-291. http://dx.doi.org/10.5465/amr.2011.0193
Arregle, J. L., Miller, T. L., Hitt, M. A., & Beamish, P. W. (2013). Do regions matter? An integrated institutional and semiglobalization perspective on the internationalization of MNEs. Strategic Management Journal, 34(8), 910-934. http://dx.doi.org/10.1002/smj.2051
Bass, A. E., & Chakrabarty, S. (2014). Resource security: Competition for global resources, strategic intent, and governments as owners. Journal of International Business Studies, 45(8), 961-979. http://dx.doi.org/10.1057/jibs.2014.28
Baum, J. A., & Korn, H. J. (1999). Dynamics of dyadic competitive interaction. Strategic Management Journal, 20(3), 251-278. http://dx.doi.org/10.1002/(SICI)1097-0266(199903)20:3%3C251::AID-SMJ23%3E3.0.CO;2-H
Baum, J. A., & Korn, H. J. (1996). Competitive dynamics of interfirm rivalry. Academy of Management Journal, 39(2), 255-291. http://dx.doi.org/10.2307/256781
Bélanger, N., Desaulniers, G., Soumis, F., Desrosiers, J., & Lavigne, J. (2006). Weekly airline fleet assignment with homogeneity. Transportation Research Part B: Methodological, 40(4), 306-318. http://dx.doi.org/10.1016/j.trb.2005.03.004
Bettis, R. A., & Weeks, D. (1987). Financial returns and strategic interaction: The case for instant photography. Strategic Management Journal, 8(6), 549-563. http://dx.doi.org/10.1002/smj.4250080605
Borenstein, S. (1989). Hubs and high fares: Dominance and market power in the U.S. airline industry. RAND Journal of Economics, 20(3), 344–365. http://dx.doi.org/10.2307/2555575
Bou, J. C., & Satorra, A. (2007). The persistence of abnormal returns at industry and firm levels: Evidence from Spain. Strategic Management Journal, 28(7), 707-722. http://dx.doi.org/10.1002/smj.586
Boyd, J. L., & Bresser, R. K. F. (2008). Performance implications of delayed competitive responses: Evidence from the U.S. retail industry. Strategic Management Journal, 29(10), 1077-1096. http://dx.doi.org/10.1002/smj.710
Buck, S., & Lei, Z. (2004). Charter airlines: Have they a future? Tourism and Hospitality Research, 5(1), 72-78. http://dx.doi.org/10.1057/palgrave.thr.6040007
Burghouwt, G. (2007). Airline network development in Europe and its implications for airport planning. Farnham: Ashgate Publishing, Ltd.
Chang, S. J., & Wu, B. (2014). Institutional barriers and industry dynamics. Strategic Management Journal, 35(8), 1103-1123. http://dx.doi.org/10.1002/smj.2152
Chen, E. L., Katila, R., McDonald, R., & Eisenhardt, K. M. (2010). Life in the fast lane: Origins of competitive interaction in new vs. established markets. Strategic Management Journal, 31(13), 1527-1547. http://dx.doi.org/10.1002/smj.894
Chen, M. J. (1996). Competitor analysis and interfirm rivalry: Toward a theoretical integration. Academy of Management Review, 21(1), 100-134. http://dx.doi.org/10.2307/258631
Chen, M. J., & Hambrick, D. C. (1995). Speed, stealth, and selective attack: How small firms differ from large firms in competitive behavior. Academy of Management Journal, 38(2), 453-482.
Chen, M. J., & Miller, D. (1994). Competitive attack, retaliation and performance: An expectancy‐valence framework. Strategic Management Journal, 15(2), 85-102. http://dx.doi.org/10.1002/smj.4250150202
Chen, M. J., Su, K. H. & Tsai, W. (2007). Competitive tension: The awareness-motivation-capability perspective. Academy of Management Journal, 50(1), 101-118. http://dx.doi.org/10.5465/amj.2007.24162081
Compagni, A., Mele, V., & Ravasi, D. (2015). How early implementations influence later adoptions of innovation: Social positioning and skill reproduction in the diffusion of robotic surgery. Academy of Management Journal, 58(1), 242-278. http://dx.doi.org/10.5465/amj.2011.1184
Cusumano, M. A., Kahl, S. J., & Suarez, F. F. (2015). Services, industry evolution, and the competitive strategies of product firms. Strategic Management Journal, 36(4), 559-575. http://dx.doi.org/10.1002/smj.2235
Doganis, R. (2005). Flying off-course. New York, London: Routledge, Taylor & Francis Group.
Doganis, R. (2006). The airline business. New York, London: Routledge, Taylor & Francis Group.
Ellram, L. M., Tate, W. L., & Feitzinger, E. G. (2013). Factor‐market rivalry and competition for supply chain resources. Journal of Supply Chain Management, 49(1), 29-46. http://dx.doi.org/10.1111/jscm.12001
Ferrier, W. (2000) Playing to win: The role of competitive disruption and aggressiveness. In M. Hitt, R. Bresser, D. Heuskel, & R. Nixon (Eds.), Winning Strategies in a Deconstructing World (pp. 317-327). New York: John Wiley & Sons.
Ferrier, W. J. (2001). Navigating the competitive landscape: The drivers and consequences of competitive aggressiveness. Academy of Management Journal, 44(4), 858-877. http://dx.doi.org/10.2307/3069419
Ferrier, W., Smith, K., & Grimm, C. (1999). The role of competition in market share erosion and dethronement: A study of industry leaders and challengers. Academy of Management Journal, 42(4), 372–388. https://doi.org/10.5465/257009
Ferrier, W. J., MacFhionnlaoich, C., Smith, K., & Grimm, C. (2002). The impact of performance distress on aggressive competitive behavior: A reconciliation of competing views. Managerial and Decision Economics, 23(4-5), 301-316. http://dx.doi.org/10.1002/mde.1067
Francis, G., Humphreys. I., & Fry, F. (2005). The nature and prevalence of the use of performance measurement techniques by airlines”, Journal of Air Transport Management, 11(4), 207-217. http://dx.doi.org/10.1016/j.jairtraman.2004.10.003
Gayle, P. G. (2008). An empirical analysis of the competitive effects of the delta/continental/northwest code-share alliance. The Journal of Law and Economics, 51(4), 743-766. http://dx.doi.org/10.1086/595865
Gerede, E. (2015). Havayolu İşletmeciliğine İlişkin Temel Kavramlar. In Havayolu Taşımacılığı ve Ekonomik Düzenlemeler Teori ve Türkiye Uygulaması (pp. 1-46).
Gillen, D. (2006). Airline business models and networks: Regulation, competition and evolution in aviation markets. Review of Network Economics, 5(4), 366-385. http://dx.doi.org/10.2202/1446-9022.1103
Gimeno, J. (1999). Reciprocal threats in multimarket rivalry: Staking out “spheres of influence” in the U.S. airlines industry. Strategic Management Journal, 20(2), 101–128. http://dx.doi.org/10.1002/(SICI)1097-0266(199902)20:2%3C101::AID-SMJ12%3E3.0.CO;2-4
Gimeno, J., & Woo, C. Y. (1996). Hypercompetition in a multimarket environment: The role of strategic similarity and multimarket contact in competitive de-escalation. Organization Science, 7(3), 322-341. http://dx.doi.org/10.1287/orsc.7.3.322
Glew. (2017). What is net profit and how to calculate it? Retrieved from https://glew.io/tip/net-profit-calculate
Gnyawali, D. R., & Madhavan, R. (2001). Cooperative networks and competitive dynamics: A structural embeddedness perspective. Academy of Management Review, 26(3), 431-445. http://dx.doi.org/10.2307/259186
Gudmundsson, S.V., & Lechner, C. (2006). Multilateral airline alliances: Balancing strategic constraints and opportunities. Journal of Air Transport Management, 12(3), 153-158. http://dx.doi.org/10.1016/j.jairtraman.2005.11.007
Gündüz, Ç., & Duyar, M. (2018). Küçülten demokrasi: Sahraalti Afrika ülkeleri. Süleyman Demirel Üniversitesi Sosyal Bilimler Enstitüsü Dergisi, (31), 213-233.
Gündüz, E. (2013). The competitive tension as a moderator for strategic innovation. Procedia-Social and Behavioral Sciences, 99, 553-561. http://dx.doi.org/10.1016/j.sbspro.2013.10.525
Gündüz, E., & Semerciöz, F. (2012). The relation between competitive tension and strategic innovation. Procedia-Social and Behavioral Sciences, 58, 29-39. http://dx.doi.org/10.1016/j.sbspro.2012.09.975
Haleblian, J., McNamara, G., Kolev, K., & Dykes, B. J. (2012). Exploring firm characteristics that differentiate leaders from followers in industry merger waves: A competitive dynamics perspective. Strategic Management Journal, 33(9), 1037-1052. http://dx.doi.org/10.1002/smj.1961
Hanlon, P. (2007). Global airlines. Oxford: Butterworth-Heinemann.
Hitt, M. A., & Xu, K. (2016). The transformation of China: Effects of the institutional environment on business actions. Long Range Planning, 49(5), 589-593. http://dx.doi.org/10.1016/j.lrp.2015.02.006
Hitt, M. A., Hoskisson, R. E., & Ireland, R. D. (2016). Strategic Management: Competitiveness & Globalization Concepts and Cases. Boston: Cengage Learning.
Hooper, P. (2005). The environment for Southeast Asia’s new and evolving airlines. Journal of Air Transport Management, 11(5), 335-347. http://dx.doi.org/10.1016/j.jairtraman.2005.07.004
Hsieh, K. Y., Tsai, W., & Chen, M. J. (2015). If they can do it, why not us? Competitors as reference points for justifying escalation of commitment. Academy of Management Journal, 58(1), 38-58. http://dx.doi.org/10.5465/amj.2011.0869
Hsu, C. I., & Wen, Y. H. (2003). Determining flight frequencies on an airline network with demand–supply interactions. Transportation Research Part E: Logistics and Transportation Review, 39(6), 417-441. http://dx.doi.org/10.1016/S1366-5545(02)00060-1
Ismail, N. A., & Jenatabadi, H. S. (2014). The influence of firm age on the relationships of airline performance, economic situation and internal operation. Transportation Research Part A: Policy and Practice, 67, 212-224. http://dx.doi.org/10.1016/j.tra.2014.06.010
Ivaldi, M., Petrova, M., & Urdanoz, M. (2022). Airline cooperation effects on airfare distribution: An auction-model-based approach. Transport Policy, 115, 239-250. http://dx.doi.org/10.1016/j.tranpol.2021.11.006
Kagan, J. (2020). Interest Expense. Investopedia. Retrieved from https://www.investopedia.com/terms/i/interestexpense.asp#:~:text=Interest%20expense%20is%20a%20non,principal%20amount%20of%20the%20debt
Klophaus, R., Conrady, R., & Fichert, F. (2012). Low cost carriers going hybrid: Evidence from Europe. Journal of Air Transport Management, 23, 54-58. http://dx.doi.org/10.1016/j.jairtraman.2012.01.015
Kor, Y. Y., & Mahoney, J. T. (2005). How dynamics, management, and governance of resource deployments influence firm‐level performance. Strategic Management Journal, 26(5), 489-496. http://dx.doi.org/10.1002/smj.459
Lee, H., Smith, K., Grimm, C., & Schomburg, A. (2000). Timing, order and durability of new product advantages with imitation. Strategic Management Journal, 21(1), 23-30. http://dx.doi.org/10.1002/(SICI)1097-0266(200001)21:1%3C23::AID-SMJ64%3E3.0.CO;2-0
Lim, L. K. (2013). Mapping competitive prediction capability: Construct conceptualization and performance payoffs. Journal of Business Research, 66(9), 1576-1586. http://dx.doi.org/10.1016/j.jbusres.2012.09.021
MacMillan, I., McCaffery, M. L., & Wijk, G. V. (1985). Competitors’ responses to easily imitated new products—exploring commercial banking product introductions. Strategic Management Journal, 6(1), 75-86. http://dx.doi.org/10.1002/smj.4250060106
McGrath, R. G., Chen, M. J., & MacMillan, I. C. (1998). Multimarket maneuvering in uncertain spheres of influence: Resource diversion strategies. Academy of Management Review, 23(4), 724-740. http://dx.doi.org/10.2307/259059
Miller, D., & Chen, M (1994). Sources and consequences of competitive inertia. Administrative Science Quarterly, 39(1), 1-23.
Miller, D., & Chen, M. J. (1996a). Nonconformity in competitive repertoires: A sociological view of markets. Social Forces, 74(4), 1209-1234. http://dx.doi.org/10.2307/2580349
Miller, D., & Chen, M.J. (1996b). The simplicity of competitive repertoires: An empirical analysis. Strategic Management Journal, 17(6), 419-440. http://dx.doi.org/10.1002/(SICI)1097-0266(199606)17:6%3C419::AID-SMJ818%3E3.0.CO;2-Z
Ndofor, H. A., Sirmon, D. G., & He, X. (2011). Firm resources, competitive actions and performance: Investigating a mediated model with evidence from the in‐vitro diagnostics industry. Strategic Management Journal, 32(6), 640-657. http://dx.doi.org/10.1002/smj.901
Pei, W., Li, J.-H., & Tan, B.-L. (2015). A Study of the application of competitive dynamics theory integrated with Ahp - A case study of Taiwan’s listed automakers. International Journal of Organizational Innovation, 7(3), 145-161.
Petrović, D., Puharić, M., & Kastratović, E. (2018). Defining of necessary number of employees in airline by using artificial intelligence tools. International Review, (3-4), 77-89. http://dx.doi.org/10.5937/IntRev1804077P
Porter, M. (1980). Competitive Strategy: Techniques for Analyzing Industries and Competitors. New York: The Free Press.
Porter, M. (1985). Competitive Advantage: Creating and Sustaining Superior Performance. New York: The Free Press.
Rindova, V., Ferrier, W. J., & Wiltbank, R. (2010). Value from gestalt: how sequences of competitive actions create advantage for firms in nascent markets. Strategic Management Journal, 31(13), 1474-1497. http://dx.doi.org/10.1002/smj.892
Silverman, B. S., & Baum, J. A. (2002). Alliance-based competitive dynamics. Academy of Management Journal, 45(4), 791-806.
Sirmon, D. G., Hitt, M. A., Arregle, J. L., & Campbell, J. T. (2010). The dynamic interplay of capability strengths and weaknesses: investigating the bases of temporary competitive advantage. Strategic Management Journal, 31(13), 1386-1409. http://dx.doi.org/10.1002/smj.893
Smith K. G., Ferrier, W. J. & Ndofor, H. (2001). Competitive Dynamics research: Critique and future directions. In M. A. Hitt, E. F. Freeman, & J. S. Harrison (Eds.), The Blackwell Handbook of Strategic Management (pp. 315–361). Oxford: Blackwell.
Smith, K. G., Grimm, C. M., Chen, M. J., & Gannon, M. J. (1989). Predictors of response time to competitive strategic actions: Preliminary theory and evidence. Journal of Business Research, 18(3), 245-258. http://dx.doi.org/10.1016/0148-2963(89)90048-9
Smith, K. G., Grimm, C. M., Gannon, M. J., & Chen, M.-J. (1991). Organizational information processing, competitive responses, and performance in the U.S. domestic airline industry. Academy of Management Journal, 34(1), 60-85. http://dx.doi.org/10.2307/256302
Sönmez, R., & ve Eroğlu, U. (2017). Firmalar arası rekabetçi etkileşim: Rekabetçi hamlelerin özellikleri ve misilleme arasındaki ilişki. Yönetim Araştırmaları Dergisi, 13(1-2), 41-69.
Sönmez, R., & Eroğlu, U. (2021). Havayolu sektöründe rekabetçi hamlelerin belirlenmesi: Sektöre özgü bir tipoloji önerisi. Ege Stratejik Araştırmalar Dergisi, 12(1), 52-69.
Stiroh, K. J., & Strahan, P. E. (2003). Competitive dynamics of deregulation: Evidence from US banking. Journal of Money, Credit and Banking, 35(5), 801-828.
Taneja, N. K. (1989). Introduction to civil aviation. Lexington, MA: Lexington Books.
Taneja, N. K. (2002). Driving airline business strategies through emerging technology. Farnham: Asghate.
Tsai, W., Su, K. H., & Chen, M. J. (2011). Seeing through the eyes of a rival: Competitor acumen based on rival-centric perceptions. Academy of Management Journal, 54(4), 761-778. http://dx.doi.org/10.5465/amj.2011.64870138
Villanueva, J., Van de Ven, A. H., & Sapienza, H. J. (2012). Resource mobilization in entrepreneurial firms. Journal of Business Venturing, 27(1), 19-30. http://dx.doi.org/10.1016/j.jbusvent.2010.09.001
Yaşar, M. (2017). Analysis of the competition between transportation modes from the perspective of competitive dynamics: A study on Ankara-İstanbul transportation line. The International Journal of Transport & Logistics, 17(42), 9-19.
Yaşar, M., & Gerede E. (2020). Identification of factors affecting competitive tension in the domestic air transport market in Turkey. International Journal of Management and Economics, 56(2), 118–139.
Yerdelen Tatoğlu, F. (2016). Panel Zaman Serileri Analizi Stata Uygulamalı. İstanbul: Beta Basım Yayım Dağıtım.
Young, G., Smith, K. G., Grimm, C. M., & Simon, D. (2000). Multimarket contact and resource dissimilarity: A competitive dynamics perspective. Journal of Management, 26(6), 1217-123.
Young, G., Smith, K.G., & Grimm, C. (1996). “Austrian” and industrial organization perspectives on firm-level competitive activity and performance. Organization Science, 7(3), 243-254. http://dx.doi.org/10.1287/orsc.7.3.243
Yu, T., & Cannella Jr, A. A. (2007). Rivalry between multinational enterprises: An event history approach. Academy of Management Journal, 50(3), 665-686. http://dx.doi.org/10.5465/amj.2007.25527425
Zajac, E., & Bazerman, M. (1991). Blind spots in industry and competitor analysis: Implications of interfirm (mis)perceptions for strategic decisions. The Academy of Management Review, 16(1), 37-56. Retrieved from http://www.jstor.org/stable/258606
Zhang, Y. A., Li, Y., & Li, H. (2014). FDI spillovers over time in an emerging market: The roles of entry tenure and barriers to imitation. Academy of Management Journal, 57(3), 698-722. http://dx.doi.org/10.5465/amj.2011.0351
Appendix 1. List of airlines in the study
|
Airline name |
Country |
IATA Code |
|
Airline name |
Country |
IATA Code |
|
Turkish Airlines |
Turkey |
TK |
|
Pegasus Airlines |
Turkey |
PC |
|
Sun Express |
Turkey |
XQ |
|
Corendon Airlines |
Turkey |
XC |
|
Atlas Global |
Turkey |
KK |
|
Lufthansa |
Germany |
LH |
|
Condor |
Germany |
DE |
|
Germania |
Germany |
ST |
|
TUI Fly |
Germany |
X3 |
|
British Airways |
United Kingdom |
BA |
|
Easyjet |
United Kingdom |
U2 |
|
Jet2 |
United Kingdom |
LS |
|
Thomas Cook |
United Kingdom |
MT |
|
Air France |
France |
AF |
|
KLM |
Netherlands |
KL |
|
Aegean Airlines |
Greece |
A3 |
|
Swiss Airlines |
Switzerland |
SR |
|
Emirates |
United Arab Emirates |
EK |
|
Qatar Airways |
Qatar |
QA |
|
Air Arabia |
United Arab Emirates |
G9 |
|
Royal Jordanian |
Jordan |
RJ |
|
Aeroflot |
Russia |
SU |
|
Ukraine International Airlines |
Ukraine |
PS |
|
Air Astana |
Kazakhstan |
KC |
|
Egypt Air |
Egypt |
MS |
|
Singapore Airlines |
Singapore |
SG |
Abstrakt
CEL: Firmy, które chcą uzyskać korzystną pozycję rynkową i trwałą długoterminową przewagę konkurencyjną na rynku, angażują się w zachowania konkurencyjne. Konkurencyjne zachowanie firmy wykonują w rzeczywistych warunkach rynkowych lub przez reakcje (odwet) na te posunięcia. Ci, którzy inicjują akcję (aktorzy), oraz ci, którzy reagują na akcje (odpowiadający) i działania konkurencyjne stanowią konkurencyjną dynamikę branży. Wyniki działań konkurencyjnych prowadzonych w zakresie dynamiki konkurencji są monitorowane w zakresie funkcjonowania rynku. Celem tego badania jest ujawnienie czynników, które wpływają na wyniki operacyjne i finansowe przedsiębiorstw lotniczych konkurujących na tureckim międzynarodowym rynku lotniczym. METODYKA: W tym kontekście oceniono 26 linii lotniczych konkurujących na tureckim rynku międzynarodowych linii lotniczych w kontekście par rywalizujących w latach 2009-2018. Analiza modeli zaprojektowanych w badaniu została przeprowadzona za pomocą analizy regresji panelowej. WYNIKI: Ustalenia uzyskane w badaniu pokazują, że na względny wzrost udziału w rynku linii lotniczych pozytywny wpływ ma dojrzałość firmy, względna wielkość, zasoby finansowe, całkowita liczba lotów i jednorodność floty, a negatywny wpływ ma ich zdolność do rozmieszczenia zasobów. Według badań na względny przychód w pasażerokilometrach pozytywny wpływ ma względna wielkość linii lotniczych, ten sam model biznesowy i współczynnik obciążenia, ale negatywny wpływ mają możliwości rozmieszczenia zasobów i konkurowanie w tym samym sojuszu. Podczas gdy zdolność alokacji zasobów i efektywność linii lotniczych mają pozytywny wpływ na wynik netto, dojrzałość firmy i łączna liczba lotów mają negatywny wpływ. Udowodniono, że zdolność linii lotniczych do rozlokowania zasobów i efektywność firmy lotniczej mają pozytywny wpływ na wyniki finansowe, podczas gdy dojrzałość firmy, łączna liczba lotów i niewykorzystane zasoby mają wpływ negatywny. IMPLIKACJE: Oczekuje się, że dzięki wprowadzeniu dodatkowych zmiennych — takich jak jednorodność floty, model biznesowy, sojusze strategiczne i współdzielenie kodów — do zmiennych wykorzystywanych we wcześniejszych badaniach, niniejsze badanie wzbogaci wiedzę na temat dynamiki konkurencji. Linie lotnicze będą kierowane w swoich działaniach na konkurencyjnym rynku, rozumiejąc okoliczności, w których wykażą się lepszymi wynikami operacyjnymi i finansowymi niż ich rywale. ORYGINALNOŚĆ I WARTOŚĆ: Wiedza o tym, w jakich sytuacjach linie lotnicze wykażą się lepszymi wynikami operacyjnymi i finansowymi w porównaniu ze swoimi konkurentami, wpłynie na zachowania przed podjęciem działań na konkurencyjnym rynku.
Słowa kluczowe: dynamika konkurencji, konkurencja, zarządzanie strategiczne, linie lotnicze, analiza danych panelowych, wyniki finansowe, wyniki operacyjne
Biographical notes
Mehmet Yasar currently works at the Department of Civil Aviation Management, Kastamonu University. Mehmet does research in Competitive Dynamics, Air Transport Management, Strategic Management and Managerial Economics.
Ender Gerede currently works as a Professor at Air Transport Management Department, Faculty of Aeronautics and Astronautics, Eskisehir Technical University, Eskisehir, Turkey. Ender does research in Safety Management, Air Transport Management, Strategic Management and Risk Analysis, and Human Factor Psychology.
Authorship contribution statement
Mehmet Yaşar: Conceptualization, Data collecting, Formal analysis, Methodology, Vsualization, Writing. Ender Gerede: Writing, Editing, Supervision, Validation.
Conflicts of interest
The authors declare no conflict of interest.
Citation (APA Style)
Yaşar, M., & Gerede, E. (2023). Examination of the factors determining the operational and financial performance of airlines: The case of the Turkish international airline market. Journal of Entrepreneurship, Management, and Innovation, 19(4), 111-145. https://doi.org/10.7341/20231944