


Received 21 June 2023; Revised 9 August 2023, 30 August 2023; Accepted 7 September 2023.
This is an open access paper under the CC BY license (https://creativecommons.org/licenses/by/4.0/legalcode).
Agnieszka Matuszewska-Pierzynka, Assistant Professor, Department of International Business and Trade, Faculty of Economics and Sociology, University of Lodz, P.O.W. St. 3/5, Lodz, 90-255, Poland, e-mail: This email address is being protected from spambots. You need JavaScript enabled to view it., corresponding author. 
Urszula Mrzygłód, Assistant Professor, Department of Sustainable Market Processes, Faculty of Economics, University of Gdansk, Jana Bażyńskiego St. 8, Gdańsk, 80-309, Poland, e-mail: This email address is being protected from spambots. You need JavaScript enabled to view it.
Aleksandra Pieloch-Babiarz, Assistant Professor, Department of International Finance and Investment, Faculty of Economics and Sociology, University of Lodz, P.O.W. St. 3/5, Lodz, 90-255, Poland, e-mail: This email address is being protected from spambots. You need JavaScript enabled to view it.
Abstract
PURPOSE: Theoretical and empirical research on corporate sustainability focuses on the relationship between environmental, social, and governance (ESG) performance and profitability or market value; little attention is given to describing their effect on dividend policy. Therefore, the main purpose of this paper is to address the research gap by identifying the relationship between corporate sustainability performance and the stability of dividend payouts. To achieve this goal, we formulated a general research hypothesis that there is a positive link between an enterprise’s ESG performance and its propensity to pay stable dividends. This research hypothesis is operationalized by the following five specific hypotheses: (1) the link between the overall ESG score and the propensity to pay stable dividends is positive; (2) the link between the environmental pillar score and the propensity to pay stable dividends is positive; (3) the link between the social pillar score and the propensity to pay stable dividends is positive; (4) the link between the governance pillar score and the propensity to pay stable dividends is positive; (5) the link between the ESG controversies score and the propensity to pay stable dividends is positive. METHODOLOGY: The hypothesis was empirically verified using a logistic regression model among the world’s largest non-financial enterprises listed in the Global 500 of 2021 for the years 2012–2021. The specifications of the general model include sustainability variables such as environmental, social, and governance pillar scores, as well as the ESG controversies score, which measures an enterprise’s exposure to environmental, social, and governance controversies and negative events reflected in global media. The financial ratios, such as a return on assets, current ratio, and debt-to-equity ratio, are considered control variables in the model specifications. The research was extended by implementing descriptive statistics and Pearson correlation coefficients. All required financial and sustainability data were retrieved from the London Stock Exchange Group (LSEG) Eikon database. FINDINGS: The results of the estimation revealed that: (1) the effect of integrated ESG activities on payout stability is statistically significant and negative only in model specifications without the ESG controversies; (2) the effect of the environmental dimension is statistically significant and negative only when other particular ESG pillars are not considered; (3) the effect of the social dimension is statistically significant and negative, only when the governance dimension and the ESG controversies are not considered together in the same model specification; (4) the effect of the governance dimension is statistically significant and positive only if other particular pillars are considered together in one model specification, both with and without the ESG controversies; (5) the effect of the ESG controversies is statistically significant and positive in each model specification. Therefore, the general research hypothesis cannot be confirmed because only the fifth specific research hypothesis can be positively verified in all model specifications. IMPLICATIONS: Further research should be conducted on the relationship between corporate sustainability performance and dividend policy. It should consider not only commonly applied ESG scores but also the ESG controversies score, which was statistically significant in this research. Governments and international organizations should cooperate with companies that provide ESG data to make ESG scores, including the ESG controversies score, publicly available to all stakeholder groups, which would help to reduce the information gap. Managers should pay more attention to increasing the visibility of ESG initiatives from the perspective of risk, which they allow to avoid controversies in particular corporate sustainability dimensions. ORIGINALITY AND VALUE: The value added of this paper is that it investigates the relationship between ESG performance and payout policy, which was not thoroughly explored in previous studies, especially in the context of an enterprise’s controversial ESG activities. To fill the research gap in the literature, the authors incorporated the ESG controversies score as an independent variable in the model specifications, which is a novelty in research on dividend policy.
Keywords: dividend policy, dividend stability, ESG scores, ESG controversies score, global enterprises, ESG performance
INTRODUCTION
Corporate sustainability means creating long-term value for an enterprise’s direct and indirect stakeholders by meeting their current and future expectations (Dyllick & Hockerts, 2002; Giovannoni & Fabietti, 2013; Sanders & Wood, 2015; World Commission on Environment and Development [WCED], 1987). Theoretical research on corporate sustainability focuses on building a holistic business model to explain the general mechanisms of transforming an enterprise’s environmental, social, and governance (ESG) efforts into the satisfaction of various stakeholder groups (e.g., shareholders, employees, customers, suppliers, local communities) and corporate financial performance (Perrini et al., 2011; Kantabutra & Ketprapakorn, 2020). Perrini et al. (2011) presented a multilevel framework for the relationship between corporate sustainability performance and corporate financial performance. In it, integrated socially responsible activities in certain management areas, like internal organization, customers, supply chains, society, the natural environment, and corporate governance, can influence revenues and costs by affecting stakeholder performance drivers. These drivers include employee satisfaction, customer trust, reputation, innovativeness, and reliability. Kantabutra and Ketprapakorn (2020) explained that when members of an enterprise who are deeply involved in achieving its mission implement corporate sustainability rules, it improves corporate sustainability performance in economic, environmental, social, and governance dimensions. This increases the satisfaction of stakeholders and enhances firm reputation and brand equity. Both these guides to the link of corporate sustainability with an enterprise’s financial performance are based on the Triple Bottom Line model created by Elkington (1997) and modified by others (Jonker & Witte, 2006; Oželienė, 2017), where the crucial issue is to maintain a balance between economic prosperity, social equality and environmental quality under the rules of good governance, being recognized as the fourth dimension of corporate sustainability (United Nations [UN], 2012).
By contrast, empirical research aims to identify a statistically significant relationship between corporate sustainability performance and corporate financial performance, i.e. profitability or market value (Ziegleret al., 2007; Wagner, 2010; Soana, 2011; Barnett & Salomon, 2012; Nolletet al., 2016; Tuppuraet al., 2016; Xiao et al., 2018; Nizam et al., 2019; Jha & Rangarajan, 2020; Behl et al., 2022; Douissa & Azrak, 2022). The previous empirical research on the relationship between corporate sustainability performance and corporate financial performance referred rather indirectly to an enterprise’s individual stakeholder groups, which are beneficiaries of corporate sustainability. Additionally, the consideration of shareholders is not comprehensive as researchers mainly focus on the effect of ESG scores on the share value and less on the dividend payout. As a result, this field of research is still not sufficiently explored.
To the best of our knowledge, few empirical papers describe the results of research on the impact of ESG scores on the level of dividend (Mihancea et al., 2021) or its stability (Benlemlih, 2019; Matos, et al., 2020; Dahiya, et al., 2023). The link between corporate sustainability performance and dividend policy can be explained against the background of fundamental theories of enterprises, such as signaling theory, agency theory, and stakeholder theory. On the one hand, as Matos et al. (2020) suggest, enterprises with high ESG scores have a greater propensity to pay greater dividends to avoid overinvesting in sustainable initiatives and to deal with agency problems (Jensen & Meckling, 1976). On the other hand, a high dividend level, which is related to higher ESG scores, sends a positive signal to the market (Bhattacharya, 1979) and shows that financing ESG activities for particular stakeholder groups does not harm an enterprise’s profitability (Stubbs & Rogers, 2013). Enterprises aim to smooth out dividends and still pay them out when profitability decreases, which signals their good financial standing and high future performance (Lin & Lee, 2021; Huang et al., 2022).
Therefore, this paper addresses the research gap by identifying the relationship between corporate sustainability performance and dividend payout stability. Following the findings of Matos et al. (2020) and Benlemlih (2019) regarding the impact of ESG scores on dividend policy and the fundamental theories of enterprises, a research hypothesis was formulated that posits a positive link between an enterprise’s ESG performance and its propensity to pay stable dividends. The general research hypothesis is operationalized by the following five specific hypotheses: (1) the link between the overall ESG score and the propensity to pay stable dividends is positive; (2) the link between the environmental pillar score and the propensity to pay stable dividends is positive; (3) the link between the social pillar score and the propensity to pay stable dividends is positive; (4) the link between the governance pillar score and the propensity to pay stable dividends is positive; (5) the link between the ESG controversies score and the propensity to pay stable dividends is positive. These hypotheses were empirically verified using a logistic regression model among the world’s largest non-financial enterprises listed in the Global 500 of 2021 for the years 2012–2021.
The originality of the research relates to the inclusion of the ESG controversies score, which measures an enterprise’s exposure to ESG controversies and negative events reflected in global media, and has not been widely used (Casey et al., 2020). In other words, the ESG controversies score can be crucial for shareholders as an important risk measure of ESG dimensions of corporate sustainability within a specific enterprise, they may consider investing in. Considering the ESG controversies score in empirical research is a novelty, which is the authors’ contribution to the literature, as it extends the previous studies on dividend payouts in relation to ESG performance with a new analytical perspective. The descriptive statistics and the Pearson correlation coefficients have also been analyzed. All required financial and sustainability data were retrieved from the London Stock Exchange Group (LSEG) Eikon (formerly Refinitiv) database.
The paper is structured as follows. Section 1 describes the current literature concerning the relationship between corporate sustainability performance and dividend policy. Section 2 explains the research methodology, providing descriptions of the variables and model specifications. The next section presents and discusses the main results of the empirical research. The last section contains the most salient findings and final conclusions.
LITERATURE REVIEW
Payout policy is one of the most important elements of the long-term financing of enterprises. Enterprises embrace diverse dividend payment strategies, each exhibiting a distinct level of variability. This paper focuses on a dividend policy strategy in which an entity maintains a stable dividends-to-earnings ratio over time, which is referred to as a stable payout ratio. Maintaining this ratio at a constant level implies that a company adheres to a stable profit-sharing principle with shareholders and safeguards its growth potential (Matos et al., 2020).
A company’s sustainability efforts are another key area where value distribution occurs. As such, corporate sustainability involves generating long-term value for an enterprise’s various stakeholder groups (Dyllick & Hockerts, 2002; Sanders & Wood, 2015). Indeed, the significance of corporate policies in restoring sustainability in the world economy has led to increased interest from market regulators and the public. As a result, there has been a growing focus on studies within corporate finance that investigate corporate social responsibility (CSR) and environmental, social and governance (ESG) practices on various factors, such as market value, cost of capital, and risk measures (Gillan, Koch, & Starks, 2021). Still, the relationship between dividend policy and CSR/ESG has not been thoroughly investigated.
This relationship can be explained using basic theories of enterprises, such as agency, signaling, and stakeholder theories. Agency theory proposes that separating company ownership and management results in information asymmetry between agents (managers) and shareholders (Jensen & Meckling 1976). The arising conflicting interests are more pronounced in companies with substantial free cash flow, which enables managers to overinvest, potentially reducing shareholder value (Jensen, 1986).
Overinvestment is also possible in responsible and sustainable corporate initiatives. As Barnea and Rubin (2010) found, corporate insiders, including managers, may pursue CSR expenditures beyond the point of maximizing firm value because they gain personal benefits, such as enhanced reputation, and a selfish pleasure – the “warm-glow” feeling (Andreoni 1990). Barnea and Rubin (2010) discovered that managers’ incentive to overinvest in social practices is mitigated by insiders’ ownership and leverage. While the former underscores the significance of costs held by insiders associated with such practices, the latter captures the external monitoring mechanism. Additionally, Brown, Helland and Smith (2006) confirmed that agency costs help explain corporate charitable practices.
Following Jensen and Meckling (1976), Easterbrook (1984), and Jensen (1986), agency costs can be effectively addressed by dividend payments that constrain the availability of free cash flow, which might otherwise be exploited by self-interested managers. Hence, payout policy can significantly influence decisions and function as a monitoring mechanism (Easterbrook, 1984). Consequently, cash-abundant companies should increase dividend payments to prevent overinvestment in ESG initiatives. However, following Rozeff (1982), increasing dividends forces companies to seek external financing, which increases the transaction costs of external financing. In other words, increasing dividends relative to earnings (payout ratio) generates more external financing. While companies want to obtain this financing on favorable terms, they need to reveal additional information on their financial condition (Lloyd, Jahera, & Page, 1985).
In the second theoretical approach, informational asymmetries also play a significant role in explaining corporate payouts. Dividends thus serve as a positive signal from a company, helping investors assess a company’s profitability, value (Bhattacharya 1979) and prospects. Conversely, information on ESG initiatives may also be relevant for outsiders, as it reveals the quality of the company’s operations (Huang 2022), offers an additional monitoring tool (Hendijani Zadeh 2021) and enhances the company’s reputation (Benlemlih 2019). In this respect, the predictions of signaling theory are not clear-cut. On the one hand, signals from ESG practices and dividends may act as substitutes, as highlighted by Ellili’s (2022) research review. This suggests that deeper engagement in ESG actions is inversely related to dividends. On the other hand, Benlemlih (2019) mentioned the importance of balancing the interests of shareholders and non-financial stakeholders. Consequently, socially responsible companies that uphold a favorable dividend policy signal to markets that they also consider shareholder interests (Benlemlih 2019; Matos et al. 2020).
This perspective aligns closely with stakeholder theory (Freeman et al., 2004; Freeman et al., 2010), which asserts that managers’ obligations surpass the goal of maximizing shareholder value. The criticism of stakeholder theory is centered on its perceived deficiency in providing clear guidelines for navigating trade-offs among competing stakeholder interests, which may result in higher agency costs (Jensen, 2002). The proponents of this theory contend that managers should be more aware of how value is actually created and manage the interests of all stakeholders, including shareholders (Freeman et al., 2010). Furthermore, managers should fairly distribute wealth among those who contribute to its creation (Gallo, 2004; Samet & Jarbouri, 2017). Applying that statement to payout policies, fair distribution may imply a decrease in dividends for shareholders (Matos et al., 2020). An opposing viewpoint states that as companies are expected to act responsibly and sustainably, not only in the eyes of society but also for creditors, investors, and policymakers, adopting a more responsible approach may result in preferential treatment. For instance, it could reduce financing costs and free up the company’s available cash flow for dividend payments (Matos et al., 2020). However, prior research provides mixed evidence on how the debt market values corporate responsible actions (Menz, 2010; Attig et al., 2013; Oikonomou et al., 2014).
More significantly, stakeholder theory embraces a long-term perspective that diverges from framing the issue of wealth distribution as a zero-sum game among stakeholders. As Freeman et al. (2010) mentioned, stakeholders form a network that optimizes value over the long term. Consequently, dividend policies should center on the long-term horizon. Furthermore, while the concept of dividend policy stability can be interpreted in various ways, as seen in Matos et al. (2020) and Benlemlih (2019), in our study, stability signifies that a consistent dividend payout is maintained. From the standpoint of stakeholder theory, upholding such a ratio, while potentially challenging in the short run, provides an anchor for harmonizing the interests of diverse stakeholder groups. Thus, companies intensely engaged in ESG and CSR endeavors may be better positioned to maintain a steady payout ratio.
This paper empirically examines the relationship between ESG scores and dividend payouts in a sample of the world’s largest enterprises. Compared to corporate governance, ESG indicators consider environmental and social factors in addition to governance itself. From this perspective, using ESG rankings in research provides a much more comprehensive characterization of responsible enterprises’ activities. Compared to the extensive literature on dividends, few studies examine the relationship between CSR/ESG and payout policy.
Overall, irrespective of geographical context, most previous studies confirm that enterprises that engage more strongly in social responsibility activities tend to have more generous payout policies. Specifically, the finding that higher CSR/ESG ratings correspond to higher dividend payouts has been supported by cross-country studies encompassing entities covered by global indices (Hendijani Zadeh, 2021), European enterprises (Samet & Jarbouri, 2017; Bilyay-Erdogan et al., 2023; Zahid et al., 2023), as well as single-country studies on enterprises originating in the US (Cheung, Hu, & Schwiebert, 2018; Benlemlih, 2019), France (Salah & Amar, 2022), India (Dahiya et al., 2023), Korea (Kim & Kim, 2022), and Malaysia (Badru & Qasem, 2021). Thus, these studies confirm a positive relationship between ESG measures and dividend payments, even in emerging markets. It can be inferred that enhancing the quality of companies’ environmental, social and governance initiatives is also beneficial to their shareholders.
The results of prior research are not free from heterogeneity, however. Saeed and Zamir (2021) confirmed that higher CSR reporting and disclosures are associated with lower dividend growth and payout ratios. Their study was conducted on enterprises from seven countries, encompassing both emerging and developed economies. Additionally, Lakhal et al. (2023) suggested a negative link between ESG dimensions and dividend growth, but a positive link between ESG dimensions and dividend payout. A study by Sheikh et al. (2020) compared family and non-family-controlled enterprises and found that a greater number of CSR activities increases the propensity to pay dividends but reduces the dividend payout in dividend-paying firms. Conversely, in family firms, a greater number of CSR activities decreases the propensity to pay dividends but increases the dividend payout in dividend-paying firms. Niccolò, Battisti, Papa, and Miglietta (2020) found that the overall ESG score and its governance and environmental components are linked to lower payouts in Chinese companies. These diverse findings highlight the need for further research and show the significance of empirical approaches to the outcomes.
In addition to studies based on general ESG ratings, the literature also includes research analyzing specific dimensions of ESG. Ellili (2022) suggested that when environmental, social, and governance scores are considered together in one regression, they do not have a significant impact on the dividend payout ratio. However, when individual scores are analyzed separately in three different models, the impact of social disclosure is positive. Benlemlih (2019) identified that five components of CSR, namely community, diversity, employee relations, environment, and corporate governance, are associated with high dividend payouts. Similarly, Cheung et al. (2018) revealed that CSR scores related to community relations, corporate governance, and diversity positively correlate with dividends. However, the environmental dimension and product safety show a contrasting relationship. Additionally, Hendijani Zadeh (2021) found that transparency, in terms of both environmental and social factors, is associated with higher payouts, including higher cash payouts and higher stock repurchase payouts. Meanwhile, Salah and Amar (2022) found that only the environmental dimension has no effect on the dividend policy. This result is explained by the high costs of environmental investment that enterprises aspiring for higher environmental ratings must cover. Furthermore, Lakhal et al.’s (2023) recent cross-country study showed that nine dimensions of environmental, social, and governance pillars are linked to dividend payout. Taken together, these findings highlight the significance of specific ESG measures in understanding the relationship between ESG and dividend payments.
Few studies have specifically examined the relationship between an enterprise’s responsible practices and dividend stability. Benlemlih (2019) argued that socially responsible firms have more stable dividend payouts than socially irresponsible firms. Responsible firms adjust dividends at a slower pace, indicating a higher level of stability in their dividend policy. The same finding was confirmed by Hendijani Zadeh (2021) for the environmental and social transparency of enterprises. By contrast, Zahid et al. (2023) confirmed that higher ESG scores are associated with lower dividend growth. This finding can also be interpreted as maintaining a stable dividend policy.
Dahiya et al. (2023) revealed that socially responsible enterprises adjust their dividends quicker, suggesting that they can revert to their target dividends more quickly than their counterparts. Furthermore, Matos et al. (2020) showed that higher ESG scores coincide with a more stable dividend payout. Their study employed three measures of dividend stability, and the payout range of 2% was statistically significant for the overall ESG score and its environmental and governance dimensions. Overall, these findings suggest that enterprises with strong, responsible practices and higher ESG scores tend to exhibit greater dividend stability, indicating a long-term commitment to shareholders and sustainable business practices.
Finally, only a few studies have paid more attention to the ESG controversies component, which is disregarded in most dividend studies. Although Casey et al. (2020) presumed that more controversial enterprises are more prone to conduct less stable dividends, the controversy score does not seem strongly related to dividends within the IT industry (Casey et al., 2020). By contrast, Benlemih (2019) and Bilyay-Erdogan et al. (2023) demonstrated that being involved more in controversial practices is associated with lower dividend payments. Indeed, Benlemih (2019) confirms the significance of controversial military and alcohol practices, whereas Bilyay-Erdogan et al. (2023) validate the overall ESG controversies score for the level of enterprise dividends.
In conclusion, the authors of this paper were motivated to conduct their own research in the field due to the limited number of empirical studies on the relationship between sustainability performance (CSP) and enterprises’ dividend policies. The existing studies, such as those by Bruna & Lahouel (2022) and Lu & Taylor (2016), yield ambiguous results, partly for methodological reasons. In the empirical research described here, the researchers focus on the corporate sustainability performance only in environmental, social and governance dimensions (ESG scores), ignoring mostly the ESG controversies. The identification of this research gap became the basis for including the ESG controversies score as an explanatory variable in the proposed model specifications, along with other commonly employed ESG scores. This holistic approach may be useful for various stakeholders in reducing the information gap. In our paper, we want to verify if changes in all ESG scores are linked to stable dividend payments, defined as stable dividend payouts. In consequence, our general hypothesis is formulated as follows:
H: The link between ESG performance and propensity to pay stable dividends is
positive.
The general research hypothesis is operationalized by the following five specific hypotheses:
HS1: The link between the overall ESG score and the propensity to pay stable
dividends is positive.
HS2: The link between the environmental pillar score and the propensity to pay
stable dividends is positive.
HS3: The link between the social pillar score and the propensity to pay stable
dividends is positive.
HS4: The link between the governance pillar score and the propensity to pay
stable dividends is positive.
HS5: The link between the ESG controversies score and the propensity to pay
stable dividends is positive.
The literature on the determinants of dividend payments is extensive and examines various fundamental factors that describe a company’s financial condition (Dewasiri et al., 2019; Benlemlih, 2019; Siladjaja & Anwar, 2020; Lin & Lee, 2021; Huang et al., 2022), especially in terms of liquidity (Bilyay-Erdogan et al., 2023), financing structure (Aivazian et al. 2003; Michael, 2013; Chang, Kang, & Li, 2016; Adjaoud & Hermassi, 2017; Benlemlih, 2019), size (Denis & Osobov, 2008; Matos et al., 2020), and age (Benlemlih, 2019). Another stream of the literature is built upon the assumption that the institutional environment in which an enterprise operates can influence internal decisions regarding the payout policy (Aivazian et al., 2003; La Porta et al., 2000). Thus, this stream of research emphasizes the importance of the legal system, the extent of shareholder protection, and corporate governance rules (Aivazian et al., 2003; La Porta et al., 2000; Bilyay-Erdogan et al., 2023; Saeed & Zamir, 2021), which can also affect the link between sustainability performance and dividend policy (Yilmaz et al., 2022). Empirical evidence supports the view that stronger corporate governance is positively linked to dividends (Mitton, 2004; Sawicki, 2009), whereas poor governance practices are not only met with sharp criticism, but also considered an essential premise that leads to economic crises (Sawicki, 2009).
RESEARCH METHODS
The research hypotheses were verified using data from 2012–2021 of the world’s largest non-financial enterprises listed in the Global 500 of 2021. The world’s largest enterprises were chosen for the research sample because they are continuously assessed by the financial market and analysts in every dimension of corporate sustainability, so their ESG ratings have been estimated for many years and are not accidental. Additionally, these enterprises must transform their financial and innovative potential into ESG initiatives to balance environmental deterioration and social inequality, for which they are responsible (Gray, 2010). Therefore, these enterprises should be regarded as global leaders, not followers, both in terms of competitive market position and the level of corporate sustainability.
Initially, 265 enterprises were qualified for the research sample, but 29 were not found in the LSEG Eikon database, which was the source of all required financial and sustainability data (accessed July 9, 2022). The research sample consists of entities listed in the Global 500 of 2021, which means that some enterprises ranked in this list over the research period could stop to be listed in the Global 500 of 2021 so they are not included in this research. Twenty-eight enterprises were excluded from the sample:
- eight did not reveal data on their corporate sustainability performance;
- three did not have data for the whole ten-year period;
- thirty-seven had incomplete data for each year of the research period.
Finally, the research hypothesis was verified on a sample of 188 of the largest enterprises in the world. The sample was dominated by US enterprises (28%, which is 30% of the total observations) and enterprises from the energy sector (20%, which is 17% of the total observations) (see Tables 1 and 2).To investigate the relationship between the sustainability performance of the world’s largest enterprises, in particular, their controversial ESG activities and the propensity to pay stable dividends, data for the 188 enterprises were collected for a ten-year period. This yielded 1,511 firm-year observations, of which only 3% indicated a lack of dividend payments.
Table 1. Characteristics of the research sample by country
|
Country |
Enterprises |
Observations |
||
|
Number |
Share [%] |
Number |
Share [%] |
|
|
Australia |
2 |
1.064 |
18 |
1.191 |
|
Belgium |
1 |
0.532 |
7 |
0.463 |
|
Brazil |
3 |
1.596 |
13 |
0.860 |
|
Britain |
14 |
7.447 |
104 |
6.883 |
|
Canada |
2 |
1.064 |
17 |
1.125 |
|
China |
9 |
4.787 |
59 |
3.905 |
|
Denmark |
1 |
0.532 |
6 |
0.397 |
|
Finland |
1 |
0.532 |
2 |
0.132 |
|
France |
14 |
7.447 |
114 |
7.545 |
|
Germany |
13 |
6.915 |
99 |
6.552 |
|
India |
4 |
2.128 |
35 |
2.316 |
|
Ireland |
2 |
1.064 |
18 |
1.191 |
|
Italy |
2 |
1.064 |
16 |
1.059 |
|
Japan |
36 |
19.149 |
301 |
19.921 |
|
Luxembourg |
1 |
0.532 |
2 |
0.132 |
|
Malaysia |
1 |
0.532 |
8 |
0.529 |
|
Mexico |
1 |
0.532 |
9 |
0.596 |
|
Netherlands |
3 |
1.596 |
26 |
1.721 |
|
Norway |
1 |
0.532 |
6 |
0.397 |
|
Russia |
2 |
1.064 |
16 |
1.059 |
|
Singapore |
1 |
0.532 |
10 |
0.662 |
|
South Korea |
6 |
3.191 |
51 |
3.375 |
|
Spain |
3 |
1.596 |
15 |
0.993 |
|
Sweden |
2 |
1.064 |
17 |
1.125 |
|
Switzerland |
5 |
2.660 |
35 |
2.316 |
|
Taiwan |
3 |
1.596 |
29 |
1.919 |
|
Thailand |
1 |
0.532 |
9 |
0.596 |
|
Turkey |
1 |
0.532 |
10 |
0.662 |
|
U.S. |
53 |
28.191 |
459 |
30.377 |
|
Total |
188 |
100.000 |
1,511 |
100.000 |
Source: Own elaboration based on information from the LSEG Eikon database.
Table 2. Characteristics of the research sample by sector
|
Sector |
Enterprises |
Observations |
||
|
Number |
Share [%] |
Number |
Share [%] |
|
|
Aerospace & Defense |
7 |
3.723 |
61 |
4.037 |
|
Apparel |
2 |
1.064 |
12 |
0.794 |
|
Business Services |
1 |
0.532 |
10 |
0.662 |
|
Chemicals |
4 |
2.128 |
37 |
2.449 |
|
Energy |
37 |
19.681 |
253 |
16.744 |
|
Engineering & Construction |
6 |
3.191 |
47 |
3.111 |
|
Food & Drug Stores |
7 |
3.723 |
60 |
3.971 |
|
Food, Beverages & Tobacco |
11 |
5.851 |
95 |
6.287 |
|
Health Care |
17 |
9.043 |
145 |
9.596 |
|
Household Products |
3 |
1.596 |
30 |
1.985 |
|
Industries |
8 |
4.255 |
72 |
4.765 |
|
Materials |
10 |
5.319 |
56 |
3.706 |
|
Media |
2 |
1.064 |
19 |
1.257 |
|
Motor Vehicles & Parts |
24 |
12.766 |
204 |
13.501 |
|
Retailing |
6 |
3.191 |
55 |
3.640 |
|
Technology |
20 |
10.638 |
164 |
10.854 |
|
Telecommunications |
12 |
6.383 |
100 |
6.618 |
|
Transportation |
3 |
1.596 |
25 |
1.655 |
|
Wholesalers |
8 |
4.255 |
66 |
4.368 |
Source: Own elaboration based on information from the LSEG Eikon database.
The panel approach was not applied primarily due to the highly unbalanced nature of the panel data, which reduces the validity of individual effects – both fixed and random. The general logistic regression model is as follows:
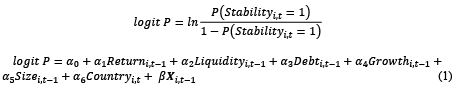
where:
Stabilityi,t is a binary variable equal to 1 if the enterprise has a stable dividend policy, defined as a change of the dividend payout ratio (ΔDPR) of the i-th enterprise between year t and year t-1, which is in the range of -2 to 2 percentage points, and 0 otherwise. This interpretation of dividend stability is consistent with the literature (Matos et al., 2020). DPR in year t is determined as the relationship between the dividend paid in year t+1 and net earnings in year t;
P(Stabilityi,t = 1) is a conditional probability of obtaining the value of 1 by the dependent variable for the given values of the explanatory variables;
Returni,t-1 is a return on assets of the i-th enterprise in year t-1 – the return on assets is calculated as the relation of net profit to total assets;
Liquidityi,t-1 means the current ratio of the i-th enterprise in year t-1 – the current ratio is calculated as the relation of current assets to current liabilities;
Debti,t-1 stands for the leverage ratio of the i-th enterprise in year t-1 – the leverage ratio is calculated as the relation of total debt to total equity;
Growthi,t-1 means the growth opportunities measured by the market-to-book value ratio of the i-th enterprise in year t-1 (Samet & Jarbouri, 2017; Cheung et al., 2018; Matos et al., 2020; Sheikh et al., 2020; Saeed & Zamir, 2021; Kim & Kim, 2022);
Sizei,t-1 stands for the size of the enterprise calculated as the natural logarithm of total assets of the i-th enterprise in year t-1;
Countryi,t is a binary variable equal to 1 if the country of origin of the i-th enterprise is a developed country in year t, and 0 otherwise. The distinction between developed and developing countries follows the WEO Database of the International Monetary Fund;
X is a vector of sustainability performance, which covers one-year lagged sustainability scores of the enterprises (ESG_Score, E_Score, S_Score, G_Score and CONT_Score);
ESG_Scorei, t-1 is the overall sustainability score of the i-th enterprise in year t-1. It is calculated based on information about environmental, social, and governance dimensions of sustainability;
E_Scorei, t-1 is the environmental pillar score of the i-th enterprise in year t-1;
S_Scorei, t-1 is the social pillar score of the i-th enterprise in year t-1;
G_Scorei, t-1 is the governance pillar score of the i-th enterprise in year t-1;
CONT_Scorei, t-1 is the ESG controversies score of the i-th enterprise in year t-1.
Table 3 describes the sustainability variables in detail. The sustainability scores (i.e., both the overall sustainability score and the individual sustainability pillar scores) take values from 0 to 100. They should be interpreted according to the following scale: <0;25) – poor score, <25;50) – satisfactory score, <50;75) – good score, <75;100) – excellent score. The ESG controversies score also ranges from 0 to 100; enterprises with no controversies receive a score of 100.
Table 3. Characteristics of the sustainability variables used in the logistic regression models
|
Variable |
Measure |
Description |
|
ESG_Score |
Environmental, social, and governance score |
The overall sustainability score, which is the sum of weighted scores in environmental, social, and governance pillars – the weights depend on the sector in which the enterprise operates. |
|
E_Score |
Environmental pillar score |
The indicator, which measures an enterprise’s effectiveness in avoiding environmental risk and taking advantage of environmental opportunities – it measures the enterprise’s impact on natural systems (i.e., the air, land and water) and complete ecosystems (resource use, emissions, innovations). |
|
S_Score |
Social pillar score |
The indicator, which measures an enterprise’s reputation and its ability to inspire the trust and loyalty of employees, customers, and society. – it measures the status of an enterprise’s license to operate (workforce, human rights, product responsibility). |
|
G_Score |
Governance pillar score |
The indicator, which measures an enterprise’s capacity to manage and control its corporate rights and obligations – it measures the internal systems and processes that make the board members and executives act in the best interests of its long-term stakeholders (management, shareholders, and CSR responsibility). |
|
CONT_Score |
Environmental, social and governance controversies score |
The indicator, which measures an enterprise’s exposure to environmental, social, and governance controversies and negative events reflected in global media. |
Source: Own elaboration based on information from the LSEG Eikon database.
Taking into consideration the general logit model, eleven model specifications are proposed and estimated (see Table 4). They differ from one another by the vector X, which consists of various sustainability scores. Model specifications 1–5 include basic ESG scores (both the overall sustainability score and the environmental, social and governance pillar scores), while specifications 6–11 also incorporate the ESG controversies score. The general logit model covers financial variables that are commonly used in research on dividend payouts (Emeka, 2020).
The study is supplemented by an analysis of descriptive statistics and correlations using the Pearson correlation coefficient. All necessary calculations were made with the Gretl statistical package.
Table 4. The general logit model specifications
|
No. |
Model specifications |
|
|
|
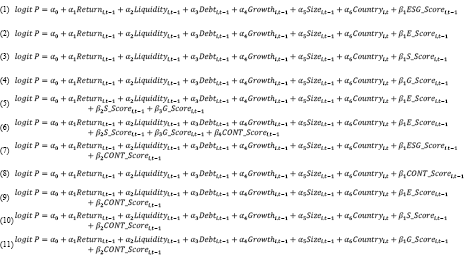
Source: Own study.
RESULTS AND DISCUSSION
Table 5 presents the descriptive statistics of the variables for the 1,511 firm-year observations. The mean dividend payout ratio, the a change of which allows us to determine whether an enterprise has a stable dividend policy, is equal to 61.747%. It means that the world’s largest enterprises pay out on average 61.747% of their net earnings. The average return to assets is 6.497%, and it is above the median (5.400%). The enterprises are rather highly profitable because Return is higher than 3.256% (Q1) for 75% of the total observations. The mean current ratio is 1.332 while the median is 1.250. The financial liquidity of the enterprises can be regarded as optimal because half of the total observations fall within the range of 1.011 (Q1) – 1.520 (Q3). The leverage ratio is, on average, 123.711%, and it is above the median (74.278%). Debt is lower than 141.777% (Q3) for 75% of the total observations; therefore, the enterprises can be recognized as little indebted, despite exhibiting significant disparities. The average market-to-book value ratio, which represents an enterprise’s growth opportunities, is equal to 3.632 (the median is 1.822). It indicates that the market value is, on average, more than three times larger than their book value. The mean Size, expressed as a natural logarithm of total assets, is 26.366. Country, which is a binary variable, takes a value of 0 when the country of origin is a developing country (such as Brazil, China, India, Malaysia, Mexico, Russia, Thailand, or Turkey) or 1 when it is a developed country (according to the World Economic Outlook Database [WEO] of the International Monetary Fund).
Table 5. Descriptive statistics of the dividend payout ratio (DPR) and explanatory variables (N = 1,511)
|
Variables |
Mean |
St. Dev. |
Q1 |
Median |
Q3 |
|
DPR, % |
61.747 |
102.438 |
26.531 |
41.210 |
67.751 |
|
Return. % |
6.497 |
4.307 |
3.256 |
5.400 |
8.719 |
|
Liquidity |
1.332 |
0.524 |
1.011 |
1.250 |
1.520 |
|
Debt. % |
123.711 |
447.654 |
42.476 |
74.278 |
141.777 |
|
Growth |
3.632 |
16.765 |
1.119 |
1.822 |
3.429 |
|
Size |
26.366 |
2.288 |
24.546 |
25.541 |
28.516 |
|
ESG_Score |
68.836 |
16.451 |
59.352 |
71.659 |
81.822 |
|
E_Score |
70.394 |
20.191 |
59.092 |
76.035 |
85.006 |
|
S_Score |
69.697 |
20.377 |
57.897 |
74.536 |
85.600 |
|
G_Score |
65.237 |
20.721 |
50.597 |
69.908 |
81.304 |
|
CONT_Score |
65.859 |
35.300 |
30.556 |
79.412 |
100.000 |
Source: Own calculations.
Referring to corporate sustainability scores, the world’s largest enterprises are at a good sustainability level because the average overall sustainability score ranges from 50 to 75 points, and more than 75% of all total observations are at least at a satisfactory level (Q1=59.352). The mean scores for the environmental and social pillars are higher than the average ESG_Score, while the mean governance pillar score is lower. The ESG controversies score is excellent for at least half of the total observations (Q2=79.412).
Table 6 shows the coefficients of the pairwise correlation between the independent variables. The strongest significant correlation among control variables is between Return and Size. The coefficient is significant at 1% and demonstrates that the negative dependence is weak (ryx=-0.305). The correlations of ESG_Score with the control variables are significant for all variables except Debt, but their coefficients imply a very weak relationship – the dependence is positive for Return and Growth while negative for Liquidity and Size. All correlations of the overall ESG score with its individual pillar scores are positive and significant at 1% – the coefficient for G_Score (ryx=0.665) is the lowest but suggests a strong dependence. The strongest significant correlation among individual sustainability pillar scores is between E_Score and S_Score – the coefficient is significant at 1% and indicates that the positive dependence is strong (ryx=0.633). The correlations of the ESG controversies score with the control variables are significant for all variables except Growth – all coefficients point to a very weak relationship. The relationship between CONT_Score and the overall sustainability score, which is significant at 1%, is negative and weak (ryx=-0.354) – CONT_Score’s strongest correlation with an individual sustainability pillar is with S_Score (ryx=-0.337).
To summarize, the independent variables considered in particular specifications of the general logit model are not strongly correlated with each other – the coefficients take values between -0.8 and 0.8 (Fooladi, 2012, pp. 691–692). The variables with correlation coefficients higher than ±0.8 are not considered in the same model specification. The collinearity between independent variables was also evaluated with Variance Inflation Factors (VIF), which were lower than 1.971 in each model specification.
Table 6. Pearson correlation matrix (N = 1,511)
|
Variables |
Return |
Liquidity |
Debt |
Growth |
Size |
ESG_Score |
E_Score |
S_Score |
G_Score |
CONT_Score |
|
Return |
1.000 |
|||||||||
|
Liquidity |
0.300*** |
1.000 |
||||||||
|
Debt |
-0.011 |
-0.073*** |
1.000 |
|||||||
|
Growth |
0.161*** |
-0.019 |
0.096*** |
1.000 |
||||||
|
Size |
-0.305*** |
0.038 |
-0.046* |
-0.100*** |
1.000 |
|||||
|
ESG_Score |
0.146*** |
-0.047* |
-0.003 |
0.062** |
-0.081*** |
1.000 |
||||
|
E_Score |
0.083*** |
-0.044* |
-0.005 |
0.039 |
0.069*** |
0.813*** |
1.000 |
|||
|
S_Score |
0.193*** |
-0.021 |
0.010 |
0.066** |
-0.171*** |
0.883*** |
0.633*** |
1.000 |
||
|
G_Score |
0.084*** |
-0.015 |
-0.007 |
0.050* |
-0.067*** |
0.665*** |
0.330*** |
0.370*** |
1.000 |
|
|
CONT_Score |
-0.090*** |
0.048* |
-0.045* |
-0.034 |
0.067*** |
-0.354*** |
-0.268*** |
-0.337*** |
-0.220*** |
1.000 |
Note: *, **, *** denote statistical significance at the 10%, 5%, and 1% level, respectively.
Source: Own calculations.
Table 7 presents the estimation results of the eleven specifications of the general logit model. Starting with the control variables, in the ten-year research period, the propensity to pay stable dividends increased as profitability increased, as measured by the return on assets. In all model specifications, the coefficient at Return is positive and significant at different significance levels (i.e., from 1% to 5%). This means that if the enterprise generates higher net earnings at an unchanged level of total assets, the probability of holding the dividend payout at the same level as in previous years increases. Rather than considering the stability of dividend payouts, other authors analyze the level of the dividend. Those studies found that rationally operating enterprises increase dividends only when the increase in net earnings is stable (Denis & Osobov, 2008; Dewasiri et al., 2019). Otherwise, if subsequent net earnings return to the level of previous years, the enterprise is likely to reduce the dividend amount, which the capital market may perceive as a negative signal. As a result, an enterprise’s market value may decrease (Siladjaja & Anwar, 2020). This finding is in line with signaling theory (Bhattacharya, 1979) and demonstrates that enterprises attempt to maintain dividends at the levels from previous years, even when their profitability increases. In other words, enterprises smooth out dividends to send a positive signal to the market about their financial performance (Lin & Lee, 2021; Huang et al., 2022).
Table 7. Estimation results (N = 1,511)
|
Variables |
Model specifications |
||||||||||
|
(1) |
(2) |
(3) |
(4) |
(5) |
(6) |
(7) |
(8) |
(9) |
(10) |
(11) |
|
|
Intercept |
0.771 (0.628) |
0.430 (0.353) |
1.061 (0.849) |
0.094 (0.074) |
0.502 (0.380) |
-0.268 (-0.193) |
0.114 (0.090) |
-0.144 (-0.115) |
-0.081 (-0.065) |
0.455 (0.349) |
-0.797 (-0.610) |
|
Return |
0.055** (2.552) |
0.056** (2.555) |
0.060*** (2.773) |
0.048** (2.203) |
0.061*** (2.808) |
0.065*** (2.952) |
0.058*** (2.664) |
0.055** (2.548) |
0.060*** (2.703) |
0.062*** (2.869) |
0.055** (2.482) |
|
Liquidity |
-0.507*** (-2.590) |
-0.506*** (-2.600) |
-0.534*** (-2.631) |
-0.478** (-2.427) |
-0.561*** (-2.649) |
-0.593*** (-2.704) |
-0.535*** (-2.629) |
-0.520** (-2.571) |
-0.539*** (-2.658) |
-0.558*** (-2.676) |
-0.528** (-2.542) |
|
Debt |
-0.002* (-1.957) |
-0.002* (-1.951) |
-0.002* (-1.922) |
-0.002** (-2.058) |
-0.002** (-1.988) |
-0.002* (-1.951) |
-0.002* (-1.906) |
-0.002* (-1.934) |
-0.002* (-1.894) |
-0.002* (-1.876) |
-0.002** (-1.986) |
|
Growth |
-0.006 (-0.468) |
-0.007 (-0.456) |
-0.005 (-0.410) |
-0.007 (-0.446) |
-0.004 (-0.316) |
-0.007 (-0.374) |
-0.009 (-0.539) |
-0.010 (-0.564) |
-0.009 (-0.524) |
-0.007 (-0.471) |
-0.011 (-0.539) |
|
Size |
-0.042 (-0.978) |
-0.030 (-0.687) |
-0.048 (-1.139) |
-0.047 (-1.076) |
-0.040 (-0.861) |
-0.038 (-0.816) |
-0.042 (-1.003) |
-0.044 (-1.054) |
-0.033 (-0.754) |
-0.046 (-1.104) |
-0.042 (-0.995) |
|
Country |
-1.150*** (-4.786) |
-1.099*** (-4.626) |
-1.136*** (-4.852) |
-1.341*** (-5.581) |
-1.137*** (-4.622) |
-1.111*** (-4.521) |
-1.127*** (-4.717) |
-1.191*** (-5.099) |
-1.070*** (-4.504) |
-1.102*** (-4.715) |
-1.262*** (-5.268) |
|
ESG_Score |
-0.009* (-1.648) |
-0.005 (-0.895) |
|||||||||
|
E_Score |
-0.009* (-1.942) |
-0.004 (-0.556) |
-0.003 (-0.482) |
-0.006 (-1.395) |
|||||||
|
S_Score |
-0.011** (-2.477) |
-0.013* (-1.743) |
-0.011 (-1.465) |
-0.008* (-1.818) |
|||||||
|
G_Score |
0.007 (1.484) |
0.012** (2.544) |
0.014*** (2.745) |
0.009** (2.004) |
|||||||
|
CONT_Score |
0.006** (2.073) |
0.006** (2.023) |
0.007** (2.356) |
0.006** (2.027) |
0.005* (1.816) |
0.008*** (2.648) |
|||||
|
McFadden R2 |
0.045 |
0.046 |
0.048 |
0.044 |
0.055 |
0.061 |
0.049 |
0.049 |
0.051 |
0.052 |
0.053 |
|
Accuracy. % |
91.300 |
91.300 |
91.300 |
91.300 |
91.300 |
91.300 |
91.300 |
91.300 |
91.300 |
91.300 |
91.300 |
|
χ2(K) (p-value) |
39.691 (0.000) |
40.760 (0.000) |
42.871 (0.000) |
39.444 (0.000) |
49.391 (0.000) |
53.943 (0.000) |
43.958 (0.000) |
43.255 (0.000) |
45.015 (0.000) |
46.270 (0.000) |
47.202 (0.000) |
|
Hosmer-Lemeshow test (p-value) |
11.073 (0.198) |
11.749 (0.163) |
3.535 (0.896) |
3.535 (0.896) |
3.432 (0.904) |
6.721 (0.567) |
6.721 (0.567) |
8.031 (0.405) |
14.152 (0.078) |
9.036 (0.339) |
8.033 (0.430) |
Note: *, **, *** denote statistical significance at the 10%, 5%, and 1% level, respectively. The z-statistic is given in brackets.
As for the second control variable, the results given in Table 7 show that the propensity to pay stable dividends decreases as liquidity increases. The estimation results show that the coefficient at Liquidity is always negative and significant at 1% or 5%, depending on the model specification. This means that if an enterprise’s current ratio increases, the probability of maintaining a stable dividend payout also increases. This result is consistent with agency theory (Jensen & Meckling, 1976), whereby both owners and managers strive to achieve their goals. However, because their goals differ, conflicts of interest escalate. As a result, an enterprise’s free cash flows may be used inefficiently. To prevent this, enterprises pay out dividends (Michael, 2013; Chang et al., 2016; Adjaoud & Hermassi, 2017), including ones that are higher than in previous years.
The results show that an increase in an enterprise’s debt decreases the propensity to pay stable dividends. The coefficient at Debt is negative in all model specifications and significant at 5% or 10%, depending on the model specifications. It can be argued that a stable dividend policy is pursued when debt does not increase. Higher debt must be serviced, which makes it difficult to pay out dividends at the previous level. This finding is consistent with Ghose et al. (2022), who showed that the propensity to pay out higher dividends decreases in heavily indebted enterprises.
As for the next two explanatory variables, i.e., Growth and Size, the coefficient is negative. However, these variables are not significant at the adopted levels of statistical significance in any of the eleven model specifications.
Finally, the coefficient at Country is negative and significant at 1% in each model specification. This means that the probability of a stable payout ratio is higher in developing countries, where the signaling effect seems stronger. Therefore, a less stable dividend policy in these countries would result in greater volatility of the enterprise’s market value.
Referring to the sustainability performance scores, which are of main interest of this paper, in specification 1, the coefficient of the ESG_Score is weakly significant (at the 10% level) and negative. Moreover, it stops being statistically significant in specification 7, when the controversies score is additionally considered in the model. The estimation results of specification 1 suggest that ESG_Score is negatively linked with our dependent variable, meaning that companies with higher overall ESG score are less likely to maintain a stable dividend policy in terms of the payout ratio. Thus, the sign of the relationship between ESG and dividend stability is the opposite of that expected in the first specific hypothesis, so it should be rejected.
Moreover, this result contradicts the findings of Matos et al. (2020) and Benlemlih (2019), which showed that enterprises with higher ESG or CSR ratings exhibit greater stability in their dividend payouts. By contrast, our result is in line with Dahiya et al. (2023), which demonstrates that companies engaging in extensive CSR activities tend to exhibit less stable dividend policies. Nevertheless, the disparity with our findings can be attributed to differences in the employed methodology (Benlemlih, 2019) and the uniqueness of the underlying samples (Benlemlih, 2019; Matos et al., 2020). Both Benlemlih (2019) and Dahiya et al. (2023) examined the speed of dividend adjustment in US and Indian companies, respectively. While Lintner’s approach (1956) is not directly utilized in our study, the divergent results obtained by Benlemlih (2019) and Dahiya et al. (2023) suggest that companies listed on less developed capital market are less likely to maintain a stable dividend policy. The significance of the Country variable additionally confirms this finding.
As the methodology of our study is similar to that of Matos et al. (2020) – based on the logistic regression with a binary dependent variable and the same source of ESG data – it again becomes important to consider the distinct characteristics of the underlying sample of their study, as it focused on European companies within the Stoxx Euro 600 index. The constituents of this index represent highly developed European capital markets, which lends a greater degree of homogeneity to the sample. This homogeneity extends to the similarity of the economic and institutional environment in which those companies operate. Conversely, although our sample encompasses transnational companies, some entities operate on less developed stock markets. Compared to EU countries, which have more harmonized regulatory policies toward financial markets and sustainable development, the institutional environment of companies included in our study is more heterogenous. Finally, EU countries have implemented policies that encompass both regulatory measures and financial incentives to encourage and support companies in their sustainability endeavors. As a result, companies and other market participants in Europe should be more aware of the importance of taking measures towards sustainability. This may have a positive impact on the overall sustainability of dividend policies in companies with high ESG scores. Zahid et al. (2023) raised the importance of a specific institutional context regarding ESG and dividend policy and the need to explore regions other than the EU. In the next step, the specific dimensions of ESG are explored. This analysis is related to verifying the next four specific hypotheses.
Starting with the environmental sustainability dimension, in specification 2, the coefficient of E_Score has a negative sign and is weakly significant at the 10% level. E_Score also appears in specifications 5, 6 and 9, however, it no longer maintains statistical significance. The results show that the second specific hypothesis should be rejected. This observation is in line with the concern raised by Ellili (2022), who suggested that including all dimensions simultaneously diminishes their individual impact on dividend policy. Nevertheless, our findings contradict the results of Benlemlih (2019), Hendijani Zadeh (2021) and Matos et al. (2020). However, their results were not as strong in terms of statistical significance. More specifically, the negative association between E_Score and the propensity to maintain a stable payout ratio can be attributed to the need to cover the high costs associated with environmental investments. The large enterprises examined in this study generally have a greater financial capacity than smaller ones to implement environmental policies and manage environmental risks. They are also more aware of how these risks may impact their business operations in the present and near future, which encourages them to pursue environmental investments. However, allocating funds for pro-environmental activities reduces the cash available and may influence decisions about earnings allocation.
On the one hand, because of the high value of environmental investments, enterprises that pursue them may face challenges in maintaining a stable dividend policy, which may lead to dividend cuts or omissions. On the other hand, large, publicly-traded enterprises are subject to greater market discipline and must consider the expectations of shareholders. From this perspective, increased environmental investments – described by a higher E_Score – intensify the agency conflict between shareholders and management, leading the latter to increase dividend payouts. In other words, significant expenditure on environmental initiatives may necessitate adjustments to dividend policies. This is driven by the need to balance environmental responsibility with meeting shareholder expectations, considering the financial implications of such investments.
Turning to an enterprise’s social sustainability dimension, the S_Score variable appears in specifications 3, 5, 6, and 10. Like E_Score, the coefficient at the S_Score is negative and significant at 5% (specification 3) or 10% (specifications 5 and 10), except for specification 6. Therefore, the third specific hypothesis, like the second one, should also be rejected. The negative sign of the coefficient suggests that an increase in the social pillar score coincides with a more unstable dividend payout ratio. In other words, more intense activities in the social dimension of ESG reduce the propensity to maintain a stable dividend policy. Our finding is stronger than the results of the Matos et al. (2020) study, in which the social dimension was not linked with stable dividend payouts in terms of the 2% payout ratio range.
On the other hand, Benlemlih (2019) revealed that individual social factors can act differently on dividend adjustments. One of the reasons why we observe a negative link between the social dimension of ESG and dividend stability may stem from the necessity to cover the costs of product development in line with a sustainable strategy. Product responsibility, together with other factors included in S_Score, may be related to higher expenditures on social and employee programs, which lower the amount of available cash resources. This line of reasoning justifies dividend decreases and omissions. However, companies that are building their market position on values of reliability, equality, and responsibility may still be subject to shareholder pressure to increase dividends, sacrificing stable dividend payouts. Moreover, as Attig et al. (2013), Oikonomou et al. (2014), and Menz (2014) suggested, sustainable practices are received by market participants differently. In such a case, companies may be more willing to adjust their dividend policy more often to send an additional signal to the market participants.
The results given in Table 7 also suggest that not all ESG dimensions are related to dividend stability in the same direction. Indeed, in contrast to E_Score and S_Score, the governance sustainability dimension is positively linked with dividend stability. The coefficient at G_Score is positive and significant at 1% for specification 6, and at 5% for specifications 5 and 11. Both specifications 5 and 6 encompass at least three ESG dimensions. Nevertheless, the G_Score coefficient is statistically insignificant when it appears in the specification as the only explanatory variable (specification 4). It means that the fourth specific hypothesis should also be rejected. Overall, this result is in line with Matos et al. (2020). The positive association between dividend stability and the corporate governance score of ESG activities suggests that efficient and transparent corporate governance rules help alleviate agency conflicts between managers and shareholders. Through efficient governance practices and enhanced monitoring of managers, the likelihood of opportunistic behavior that undermines a company’s long-term growth potential is reduced.
Finally, the controversial dimension of ESG activities is examined in specifications 6 to 11. The positive sign of the coefficient CONT_Score remains statistically significant across all specifications at 1%, 5% and 10%. This implies that enterprises with lower exposure to environmental, social and governance controversies are more likely to pay stable dividends, confirming the fifth specific hypothesis. Notably, a higher CONT_Score is indicative of decreased controversy. This result corresponds to the previous findings of Benlemlih (2019) and Bilyay-Erdogan et al. (2023), which indicate the relevance of controversial practices for an enterprise’s dividend policy. Specifically, both studies indicate that involvement in controversial practices is related to lower dividend payments.
Our findings also confirm Casey et al.’s (2020) suggestion that more controversies lead to lower dividend yield stability. One argument to support this conclusion relates to the way the controversial score is generated. Since it is based on media reports regarding various factors considered in individual ESG dimensions, the controversial score goes beyond a company’s declarative statements, subjecting them to heightened scrutiny by a wide range of stakeholders. Indeed, one aspect considered in this indicator is the infringement of shareholders’ rights. From this perspective, companies rated highly by the media may pay particular attention to appropriate investor relations, which are a part of the governance sustainability dimension and strive to maintain a stable dividend policy. In other words, controversial information regarding a company’s operations conveys an unfavorable signal to market participants, which may result in impromptu decisions concerning dividend policy to counterbalance this adverse message. Conversely, companies with a lack of controversy have no pressure to send an additional signal to investors and can maintain an unaltered dividend policy.
CONCLUSIONS
A logistic regression model was used to test the research hypothesis that there is a link between an enterprise’s ESG performance and its propensity to pay stable dividends in terms of the dividend payout ratio. The results revealed that:
- the effect of integrated ESG activities on the payout stability is statistically significant and negative only in model specifications without the ESG controversies – the first specific hypothesis is rejected;
- the effect of the environmental dimension is statistically significant and negative, but only when other particular ESG pillars are not considered – the second specific hypothesis is rejected;
- the effect of the social dimension is statistically significant and negative, but only when the governance dimension and the ESG controversies are not considered together in the same model specification – the third specific hypothesis is rejected;
- the effect of the governance dimension is statistically significant and positive only if other particular pillars are considered together in one model specification both without and with the ESG controversies – the fourth specific hypothesis is rejected;
- the effect of the ESG controversies is statistically significant and positive in each model specification – the fifth specific hypothesis is confirmed;
- the results for the control variables are consistent with the previous results.
Therefore, the general research hypothesis cannot be confirmed because only the fifth specific research hypothesis, which states that the link between the ESG controversies score and the propensity to pay stable dividends is positive, can be positively verified in all model specifications.
As the ESG controversies score was statistically significant regardless of the model specification, it is recommended that research be conducted on the relationship between corporate sustainability performance and dividend policy, taking into account not only commonly applied ESG scores but also the ESG controversies score. Governments and international organizations should cooperate with companies that provide ESG data to make ESG scores, including the ESG controversies score, publicly available to all stakeholder groups, which would help to reduce the information gap. Managers should pay more attention to increasing the visibility of ESG initiatives they undertake from the perspective of risk, which they allow, to avoid controversies in particular corporate sustainability dimensions. What is more, our research shows that although particular ESG scores are significant, they are not related to dividend stability in the same way because the expectations for environmental, social, and governance dimensions will be slightly different. Therefore, they should be considered by managers separately.
The added value of the paper is that it concerns the relationship between ESG performance and dividend stability, not the dividend amount, which has been the subject of research conducted by other authors. Additionally, our study is based on sustainability data provided by the LSEG Eikon database, which – like other leading databases such as Bloomberg, MCSI, and KLD – are characterized by objectivity and reliability, given the methodology used to produce them (Clément et al., 2023). The study was limited to large and highly traded enterprises, which are primarily of great interest to institutional investors, which is why they must maintain a relatively high level of corporate sustainability. However, the world’s largest enterprises are subject to different corporate sustainability policies and do not have the same incentives to have a stable dividend policy in terms of dividend payout ratio. Enterprises listed in global indices can be more focused on meeting the expectations of international investors by dynamically adjusting their dividends to current financial performance than by conducting a smooth dividend policy.
Finally, this study has some limitations. First, although the preliminary sample of companies was high, missing data reduced the number of observations that could be considered, which limited the possible estimation methods. In future research, with an enlarged sample, the smoothing approach and panel data estimation could be employed. Second, this study was conducted on large international corporations that operate in various countries. Therefore, the findings should be viewed with caution, as not much can be said about smaller companies that operate domestically. Third, although the variables used are in line with the dividend payment literature, an investigation of other proxies of size and dividend stability could enhance the results and provide interesting information on the relationship between ESG and dividend policy. Finally, future research could consider a cross-regional analysis to understand the interplay between ESG activities, dividend policies, and market characteristics.
Acknowledgment
The authors contributed equally to each section of the paper. This research was funded in part by the National Science Centre (Poland), Grant number: 2021/05/X/HS4/01633. For the purposes of Open Access, the author has applied a CC-BY public copyright license to any Author Accepted Manuscript (AAM) version arising from this submission. This research was also supported by funds from the Faculty of Economics and Sociology, University of Lodz, Poland and the Faculty of Economics, University of Gdansk, Poland.
References
Adjaoud, F., & Hermassi, N. (2017). The impact of corporate governance mechanisms on the dividend policy of Canadian firms: empirical study. Journal of Business, Accounting and Finance, 11(1), 90-105.
Aivazian, V., Booth, L., & Cleary, S. (2003). Do emerging market firms follow different dividend policies from US firms?. Journal of Financial Research, 26(3), 371-387. https://doi.org/10.1111/1475-6803.00064
Andreoni, J. (1990). Impure altruism and donations to public goods: A theory of warm-glow giving. The Economic Journal, 100(401), 464-477. https://doi.org/10.2307/2234133
Attig, N., El Ghoul, S., Guedhami, O., & Suh, J. (2013). Corporate social responsibility and credit ratings. Journal of Business Ethics, 117, 679-694. http://dx.doi.org/10.1007/s10551-013-1714-2
Badru, B. O., & Qasem, A. (2021). Corporate social responsibility and dividend payments in the Malaysian capital market: The interacting effect of family-controlled companies. Journal of Sustainable Finance & Investment, 1-24. https://doi.org/10.1080/20430795.2021.1979926
Barnea, A., & Rubin, A. (2010). Corporate social responsibility as a conflict between shareholders. Journal of Business Ethics, 97, 71-86. https://doi.org/10.1007/s10551-010-0496-z
Barnett, M. L., & Salomon, R. M. (2012). Does it pay to be really good? Addressing the shape of the relationship between social and financial performance. Strategic Management Journal, 33, 1304-1320. https://doi.org/10.1002/smj.1980
Behl, A., Kumari, P. S. R., Makhija, H., & Sharma, D. (2022). Exploring the relationship of ESG score and firm value using cross-lagged panel analysis: Case of the Indian Energy sector. Annals of Operations Research, 313, 231-256. https://doi.org/10.1007/s10479-021-04189-8
Ben Salah, O., & Ben Amar, A. (2022). Does corporate social responsibility affect dividend policy? Empirical evidence in the French context. Journal of Global Responsibility, 13(3), 268-289. https://doi.org/10.1108/JGR-10-2021-0082
Benlemlih, M. (2019). Corporate social responsibility and dividend policy. Research in International Business and Finance, 47, 114-138. https://doi.org/10.1016/j.ribaf.2018.07.005
Bhattacharya, S. (1979). Imperfect information, dividend policy, and “the bird in the hand” fallacy. Bell Journal of Economics, 10(1), 259-270. https://doi.org/10.2307/3003330
Bilyay-Erdogan, S., Danisman, G. O., & Demir, E. (2023). ESG performance and dividend payout: A channel analysis. Finance Research Letters, 55(Part A), 103827. https://doi.org/10.1016/j.frl.2023.103827
Brown, W. O., Helland, E., & Smith, J. K. (2006). Corporate philanthropic practices. Journal of Corporate Finance, 12(5), 855-877. https://doi.org/10.1016/j.jcorpfin.2006.02.001
Bruna, M. G., & Lahouel, B. B. (2022). CSR & financial performance: Facing methodological and modeling issues commentary paper to the eponymous FRL article collection. Finance Research Letters, 44(2), 1-8. https://doi.org/10.1016/j.frl.2021.102036
Casey Jr., K. M., Casey, K. M., & Griffin, K. (2020). Does good stewardship reduce agency costs in the IT sector? Evidence from dividend policy and ESG ratings. Global Journal of Accounting and Finance Volume, 4(1), 6-16.
Chang, K., Kang, E., & Li, Y. (2016). Effect of institutional ownership on dividends: An agency-theory-based analysis. Journal of Business Research, 69(7), 2551-2559. https://doi.org/10.1016/j.jbusres.2015.10.088
Cheung, A. (W.), Hu, M., & Schwiebert, J. (2018). Corporate social responsibility and dividend policy. Accounting and Finance, 58, 787-816. https://doi.org/10.1111/acfi.12238
Clément, A., Robinot, É., & Trespeuch, L. (2023). The use of ESG scores in academic literature: A systematic literature review. Journal of Enterprising Communities: People and Places in the Global Economy. https://doi.org/10.1108/JEC-10-2022-0147
Dahiya, M., Singh, S., & Chaudhry, N. (2023). Corporate social responsibility and dividend policy in India. Management Decision. https://doi.org/10.1108/MD-08-2022-1152
Denis, D. J., & Osobov, I. (2008). Why do firms pay dividends? International evidence on the determinants of dividend policy. Journal of Financial Economics, 89(1), 62-82. https://doi.org/10.1016/j.jfineco.2007.06.006
Dewasiri, N. J., Yatiwelle Koralalage, W. B., Abdul Azeez, A., Jayarathne, P. G. S. A., Kuruppuarachchi, D., & Weerasinghe, V. A. (2019). Determinants of dividend policy: Evidence from an emerging and developing market. Managerial Finance, 45(3), 413-429. https://doi.org/10.1108/MF-09-2017-0331
Douissa I. B., & Azrak T. (2022). Long-run dynamics between CFP and CSP in the GCC banking sector: Estimation non-statutory heterogeneous panels allowing for cross-sectional dependence. Social Responsibility Journal, 18(3), 518-533. https://doi.org/10.1108/SRJ-09-2020-0365
Dyllick, T., & Hockerts, K. (2002). Beyond the case for corporate sustainability. Business Strategy and the Environment, 11(2), 130-141. https://doi.org/10.1002/bse.323
Easterbrook, F. H. (1984). Two agency-cost explanations of dividends. The American Economic Review, 74(4), 650-659.
Elkington, J. (1997). Cannibals with Forks. The Triple Bottom Line of 21st Century Business. Oxford: Capstone Publishing Ltd.
Ellili, N. O. D. (2022). Impact of environmental, social and governance disclosure on dividend policy: What is the role of corporate governance? Evidence from an emerging market. Corporate Social Responsibility and Environmental Management, 29(5), 1-18. https://doi.org/10.1002/csr.2277
Emeka, A. H. (2020). Determinants of dividend policy: Empirical evidence from Nigerian listed firms. International Journal of Business Insights & Transformation, 13(2), 38-67.
Fooladi, M. (2012). Board characteristics and firm performance. Journal of Modern Accounting and Auditing, 8(5), 688-694.
Freeman, R. E., Harrison, J. S., Wicks, A. C., Parmar, B. L., & De Colle, S. (2010). Stakeholder theory: The state of the art. Cambridge: Cambridge University Press.
Freeman, R. E., Wicks, A. C., & Parmar, B. (2004). Stakeholder theory and “the corporate objective revisited”. Organization Science, 15(3), 364-369. https://doi.org/10.1287/orsc.1040.0066
Gallo, M. A. (2004). The family business and its social responsibilities. Family Business Review, 17(2), 135-148. https://doi.org/10.1111/j.1741-6248.2004.0000
Ghose, B., Baruah, D., & Gope, K. (2022). Propensity to propose and pay dividend: does firm characteristics matter?. Global Business Review, 1-27. https://doi.org/10.1177/09721509221110314
Gillan, S. L., Koch, A., & Starks, L.T. (2021). Firms and social responsibility: A review of ESG and CSR research in corporate finance. Journal of Corporate Finance, 66, 1-34. https://doi.org/10.1016/j.jcorpfin.2021.101889
Giovannoni, E., & Fabietti, G. (2013). What is sustainability? A review of the concept and its applications. In C. Busco, M. L. Frigo, P. Quattrone, & A. Riccaboni (Eds.). Integrated Reporting. Concepts and Cases That Redefine Corporate Accountability (pp. 21-40). Berlin: Springer. https://doi.org/10.1007/978-3-319-02168-3_2
Gray, R. (2010). Is accounting for sustainability actually accounting for sustainability...and how would we know? An exploration of narratives of organisations and the planet. Accounting Organizations and Society, 35(1), 47-62. https://doi.org/10.1080/0969160X.2011.556420
Hendijani Zadeh, M. (2021). The effect of corporate social responsibility transparency on corporate payout policies. International Journal of Managerial Finance, 17(5), 708-732. https://doi.org/10.1108/IJMF-07-2020-0386
Huang, D. Z. X. (2022). Environmental, social and governance factors and assessing firm value: Valuation, signalling and stakeholder perspectives. Accounting & Finance, 62(S1), 1983-2010. https://doi.org/10.1111/acfi.12849
Huang, L., Li, L., Wang, H., & Wu, L. (2022). Stock dividend and analyst optimistic bias in earnings forecast. International Review of Economics and Finance, 78, 643–659. https://doi.org/10.1016/j.iref.2022.01.007
Jensen, M. C., & Meckling, W. H. (1976). Theory of the firm: Managerial behavior, agency costs and ownership structure. Journal of Financial Economics, 3(4), 305-360. https://doi.org/10.1016/0304-405X(76)90026-X
Jensen, M. C. (1986). Agency costs of free cash flow, corporate finance, and takeovers. The American Economic Review, 76(2), 323-329.
Jensen, M. C. (2002). Value maximization, stakeholder theory, and the corporate objective function. Business Ethics Quarterly, 12(2), 235-256. https://doi.org/10.2307/3857812
Jha, M. K., & Rangarajan, K. (2020). Analysis of corporate sustainability performance and corporate financial performance causal linkage in the Indian context. Asian Journal of Sustainability and Social Responsibility, 5(1), 1-30. https://doi.org/10.1186/s41180-020-00038-z
Jonker, J., & Witte, M. (2006). Management Models for Corporate Social Responsibility. New York: Springer Berlin Heidelberg.
Kantabutra, S., & Ketprapakorn, N. (2020). Toward a theory of corporate sustainability: A theoretical integration and exploration. Journal of Cleaner Production, 270, 1-22. https://doi.org/10.1016/j.jclepro.2020.122292
Kim, S. I., & Kim, I. (2022). Decomposition of the dividend model: From the perspective of ESG and firm characteristics. Journal of the Korean Data Analysis Society, 24(4), 1213-1223. https://doi.org/10.37727/jkdas.2022.24.4.1213
La Porta, R., Lopez-de-Silanes, F., Shleifer, A., & Vishny, R. (2000). Investor protection and corporate governance. Journal of Financial Economics, 58(1-2), 3-27. https://doi.org/10.1016/S0304-405X(00)00065-9
Lakhal, F., Kuzey, C., Uyar, A., & Karaman, A. S. (2023). The relationship between dividend payout and corporate social responsibility: The moderating effect of shareholder friendliness and board monitoring. Journal of Cleaner Production, 394, 136297. https://doi.org/10.1016/j.jclepro.2023.136297
Lin, J. J., & Lee, C. F. (2021). Does managerial reluctance of dividend cuts signal future earnings?. Review of Quantitative Finance and Accounting, 56, 453-478. https://doi.org/10.1007/s11156-020-00899-5
Lintner, J. (1956). Distribution of incomes of corporations among dividends, retained earnings, and taxes. The American Economic Review, 46(2), 97-113.
Lloyd, W. P., Jahera, J. S., & Page, D. E. (1985). Agency costs and dividend payout ratios. Quarterly Journal of Business and Economics, 19-29.
Lu, L., & Taylor, M. (2016). Which factors moderate the relationship between sustainability performance and financial performance? A meta-analysis study. Journal of International Accounting Research, 15(1), 1-15. https://doi.org/10.2308/jiar-51103
Matos, P. V., Barros, V., & Sarmento, J. M. (2020). Does ESG affect the stability of dividend policies in Europe?. Sustainability, 12(21), 1-15. https://doi.org/10.3390/su12218804
Menz, K. M. (2010). Corporate social responsibility: Is it rewarded by the corporate bond market? A critical note. Journal of Business Ethics, 96(1), 117-134. http://dx.doi.org/10.1007/s10551-010-0452-y
Michael, N. B. (2013). Agency conflict and corporate dividend policy decisions in Nigeria. Asian Economic and Financial Review, 3(8), 1110-1121.
Mihancea, E. A., Pirtea, M. G., & Boțoc, F. C. (2021). Bibliometric analysis on the recent trends in dividend policy research. “Ovidius” University Annals, Economic Sciences Series, 21(2), 1051-1059
Mitton, T. (2004). Corporate governance and dividend policy in emerging markets. Emerging Markets Review, 5(4), 409-426. https://doi.org/10.1016/j.ememar.2004.05.003
Niccolò, N., Battisti, E., Papa, A., & Miglietta, N. (2020). Shareholder value and dividend policy: The role of ESG strategies. Proceedings of the 2020 IEEE International Conference on Technology Management, Operations and Decisions (ICTMOD). Marrakech, Morocco: IEEE, 29-33. https://doi.org/10.1109/ICTMOD49425.2020.9380585
Nizam, E., Ng, A., Dewandaru, G., Nagayev, R., & Nikoba, M. A. (2019). The impact of social and environmental sustainability on financial performance: A global analysis of the banking sector. Journal of Multinational Financial Management, 49, 35-53. https://doi.org/ 10.1016/j.mulfin.2019.01.002
Nollet, J., Filis, G., & Mitrokostas, E. (2016). Corporate social responsibility and financial performance: A non-linear and disaggregated approach. Economic Modelling, 52, 400-407. https://doi.org/10.1016/j.econmod.2015.09.019
Oikonomou, I., Brooks, C., & Pavelin, S. (2014). The effects of corporate social performance on the cost of corporate debt and credit ratings. Financial Review, 49(1), 49-75. https://doi.org/10.1111/fire.12025
Oželienė, D. (2017). A review of enterprise sustainable development models: Critical appraisal. International Scientific Journal “Science. Business. Society”, 2(2), 97-103.
Perrini, F., Russo, A., Tencati, A., & Vurro, C. (2011). Deconstructing the relationship between corporate social and financial performance. Journal of Business Ethics, 102(1), 59-76. https://doi.org/10.1007/s10551-011-1194-1
Rozeff, M. S. (1982). Growth, beta and agency costs as determinants of dividend payout ratios. Journal of Financial Research, 5(3), 249-259
Saeed, A., & Zamir, F. (2021). How does CSR disclosure affect dividend payments in emerging markets?. Emerging Markets Review, 46, 100747. https://doi.org/10.1016/j.ememar.2020.100747
Samet, M., & Jarboui, A. (2017). Corporate social responsibility and payout decisions. Managerial Finance, 43(9), 982-998. https://doi.org/10.1108/MF-01-2017-0020
Sanders, N.R., Wood, J.D. (2015). Foundations of Sustainable Business. New Jersey, NJ: Wiley.
Sawicki, J. (2009). Corporate governance and dividend policy in Southeast Asia pre-and post-crisis. The European Journal of Finance, 15(2), 211-230. https://doi.org/10.1080/13518470802604440
Sheikh, M. F., Bhutta, A. I., Rehman, B., Bazil, M., & Hassan, A. (2020). Corporate social responsibility and dividend policy: A strategic choice in family firms. Journal of Family Business Management, 12(2), 296-315. https://doi.org/10.1108/JFBM-10-2020-0096
Siladjaja, M., & Anwar, Y., (2020). The impact of innate accruals quality on the future market value moderated by dividend policy. Asian Journal of Accounting Research, 5(2), 269-283. https://doi.org/10.1108/AJAR-04-2020-0026
Soana, M. G. (2011). The relationship between corporate social performance and corporate financial performance in the bank sector. Journal of Business Ethics, 104(1), 133-148. https://doi.org/10.1007/s10551-011-0894-x
Stubbs, W., & Rogers, P. (2013). Lifting the veil on environment-social-governance rating methods. Social Responsibility Journal, 9(4), 622–640. https://doi.org/10.1108/SRJ-03-2012-0035
Tuppura, A., Arminen H., Pätäri, S., & Jantunen, A. (2016). Corporate social and financial performance in different industry contexts: The chicken or the egg? Social Responsibility Journal, 12(4), 672-686. https://doi.org/10.1108/SRJ-12-2015-0181
United Nations (2012). Future we want. Rio de Janeiro: UN.
Wagner, M. (2010). The role of corporate sustainability performance for economic performance: A firm-level analysis of moderation effects. Ecological Economics, 69(7), 1553-1560. https://doi.org/10.1016/j.ecolecon.2010.02.017
World Commission on Environment and Development (1987). Our common future. Oxford: Oxford University Press.
World Economic Outlook Database, Publications of the International Monetary Fund. Retrieved from https://www.imf.org/en/Publications/SPROLLs/world-economic-outlook-databases#sort=%40imfdate%20descending
Yilmaz, M. K., Aksoy, M., & Khan, A. (2022). Moderating role of corporate governance and ownership structure on the relationship of corporate sustainability performance and dividend policy. Journal of Sustainable Finance & Investment, 1-31. https://doi.org/10.1080/20430795.2022.2100311
Xiao, C., Wang, Q., van der Vaart, T., & van Donk, D. P. (2018). When does corporate sustainability performance pay off? The impact of Country-level sustainability performance. Ecological Economics, 146, 325-333. https://doi.org/10.1016/j.ecolecon.2017.11.025
Zahid, R. A., Taran, A., Khan, M. K., & Chersan, I. C. (2023). ESG, dividend payout policy and the moderating role of audit quality: empirical evidence from Western Europe. Borsa Istanbul Review, 23(2), 350-367. https://doi.org/10.1016/j.bir.2022.10.012
Ziegler, A., Schröder, M., & Rennings, K. (2007). The effects of environmental and social performance on the stock performance of European corporations. Environmental and Resource Economics, 37(4), 661-680. https://doi.org/10.1007/s10640-007-9082-y
Abstrakt
CEL: Teoretyczne i empiryczne badania nad zrównoważonym rozwojem przedsiębiorstw koncentrują się na związku między wynikami ESG a rentownością lub wartością rynkową, a w niewystarczającym stopniu opisują ich wpływ na politykę dywidendową. Dlatego głównym celem tego artykułu jest wypełnienie zidentyfikowanej luki badawczej poprzez określenie związku między wynikami przedsiębiorstwa w zakresie zrównoważonego rozwoju a stabilnością wypłat dywidendy. Aby osiągnąć ten cel, sformułowano główną hipotezę badawczą, zgodnie z którą związek między wynikami ESG przedsiębiorstwa a skłonnością do wypłaty stabilnej dywidendy jest pozytywny. Dla weryfikacji głównej hipotezy badawczej sformułowano pięć hipotez szczegółowych: (1) związek między zintegrowanym wynikiem ESG a skłonnością do wypłaty stabilnej dywidendy jest dodatni; (2) związek między wynikiem wymiaru środowiskowego a skłonnością do wypłaty stabilnej dywidendy jest pozytywny; (3) związek między wynikiem wymiaru społecznego a skłonnością do wypłaty stabilnej dywidendy jest pozytywny; (4) związek między wynikiem wymiaru ładu korporacyjnego a skłonnością do wypłaty stabilnej dywidendy jest pozytywny; (5) związek między wynikiem dotyczącym kontrowersji w zakresie ESG a skłonnością do wypłaty stabilnej dywidendy jest pozytywny. METODYKA: Empiryczna weryfikacja hipotezy została przeprowadzona z wykorzystaniem modelu regresji logistycznej wśród największych światowych przedsiębiorstw niefinansowych notowanych na liście Global 500 z roku 2021 w okresie badawczym 2012-2021. Specyfikacje modelu ogólnego obejmują zmienne dotyczące zrównoważonego rozwoju, takie jak wyniki wymiarów środowiskowego, społecznego i ładu korporacyjnego, a także wynik dotyczący kontrowersji w zakresie ESG, który mierzy narażenie przedsiębiorstwa na kontrowersje środowiskowe, społeczne i w systemie ładu korporacyjnego oraz negatywne zdarzenia ujawniane w światowych mediach. Ponadto wskaźniki finansowe, takie jak ROA, CR i D/E są uwzględniane w specyfikacjach modeli jako zmienne kontrolne. Badania rozszerzono o zastosowanie statystyki opisowej oraz współczynników korelacji Pearsona. Wszystkie niezbędne dane finansowe i te odnoszące się do zrównoważonego rozwoju zostały pobrane z bazy danych LSEG Eikon. WYNIKI: Wyniki estymacji wykazały, że: (1) wpływ zintegrowanych działań ESG na stabilność wypłat dywidendy jest istotny statystycznie i ujemny tylko w specyfikacjach modeli bez kontrowersji w zakresie ESG; (2) efekt wymiaru środowiskowego jest istotny statystycznie i ujemny tylko wtedy, gdy nie uwzględnia się innych filarów ESG; (3) efekt wymiaru społecznego jest istotny statystycznie i ujemny tylko wtedy, gdy wymiar ładu korporacyjnego i kontrowersje w zakresie ESG nie są rozpatrywane łącznie w tej samej specyfikacji modelu; (4) efekt wymiaru ładu korporacyjnego jest statystycznie istotny i pozytywny tylko wtedy, gdy inne filary są rozpatrywane razem w jednej specyfikacji modelu, zarówno bez, jak i z kontrowersjami w zakresie ESG; (5) efekt kontrowersji w zakresie ESG jest statystycznie istotny i pozytywny w każdej specyfikacji modelu. Zatem główna hipoteza badawcza nie może zostać potwierdzona, ponieważ tylko piąta szczegółowa hipoteza może zostać pozytywnie zweryfikowana we wszystkich specyfikacjach modelu. IMPLIKACJE: Zaleca się prowadzenie badań nad związkiem między wynikami przedsiębiorstwa w zakresie zrównoważonego rozwoju a polityką dywidendową z uwzględnieniem nie tylko powszechnie stosowanych wyników ESG, ale także wyniku dotyczącego kontrowersji w zakresie ESG. Rządy i organizacje międzynarodowe powinny współpracować z firmami dostarczającymi danych na temat wyników ESG, w tym kontrowersji w zakresie ESG, aby były one powszechnie dostępne dla wszystkich grup interesariuszy, co pomogłoby zmniejszyć lukę informacyjną. Menedżerowie przedsiębiorstw powinni zwrócić większą uwagę na prezentowanie podejmowanych inicjatyw ESG z perspektywy ryzyka, którego pozwalają one uniknąć w związku z kontrowersjami w poszczególnych wymiarach zrównoważonego rozwoju przedsiębiorstwa. ORYGINALNOŚĆ I WARTOŚĆ: Wartością dodaną tego artykułu jest zbadanie związku między wynikami ESG a polityką wypłat, co nie zostało wystarczająco przeanalizowane w poprzednich badaniach, zwłaszcza w kontekście kontrowersji dotyczących działań przedsiębiorstwa w wymiarze środowiskowym, społecznym i ładu korporacyjnego. Aby zredukować zidentyfikowaną w literaturze lukę badawczą, autorzy zdecydowali się na włączenie do specyfikacji modelu wyniku dotyczącego kontrowersji w zakresie ESG jako jednej ze zmiennych niezależnych, co stanowi swoistą nowość w badaniach nad polityką dywidendową.
Słowa kluczowe: polityka dywidendy, stabilność dywidendy, wyniki ESG, wynik dotyczący kontrowersji w zakresie ESG, przedsiębiorstwa globalne
Biographical notes
Agnieszka Matuszewska-Pierzynka, Ph.D., is an assistant professor at the Department of International Business and Trade at the Faculty of Economics and Sociology, University of Lodz (Poland). She has researched ownership transformations of state-owned enterprises, with a particular focus on employee-owned companies. However, her new research interest focuses on corporate sustainability and sustainable business strategies. She has authored many academic papers in highly-ranked international and national journals. Additionally, she has actively participated in various economics and finance conferences. What is more, she was a principal investigator of several research projects funded by the Ministry of Science and Higher Education and the University of Lodz.
Urszula Mrzygłód, Ph.D., is an assistant professor at the Department of Sustainable Market Processes at the Faculty of Economics, University of Gdansk (Poland). She specializes in financial market integration and corporate dividend policy, including dividend smoothing, financial market reactions, and alternative finance, especially drivers of crowdfunding success. She is a member of the editorial board at the Journal of Alternative Finance, has a wealth of experience in research projects financed by the National Science Centre (Poland) and the National Bank of Poland, and her works have been published in various journals, including Electronic Markets, Emerging Markets Finance and Trade, Economics & Sociology, and Bank i Kredyt.
Aleksandra Pieloch-Babiarz, Ph.D., is an assistant professor at the Department of International Finance and Investments at the Faculty of Economics and Sociology, University of Lodz (Poland). She specializes in corporate finance, dividend policy, capital markets and corporate sustainability. She has published several dozen articles in high-quality international and Polish scientific journals. She has authored several books on corporate finance and co-edited a book on entrepreneurship. Moreover, she is a reviewer in many academic journals and a member of the reviewers council of several international academic conferences. She has also been a speaker at many prestigious economic conferences. She was the head of a research project funded by the National Science Centre (Poland) and has participated as principal investigator and co-investigator in numerous research projects financed by the Ministry of Science and Higher Education and the University of Lodz.
Authorship contribution statement
Agnieszka Matuszewska-Pierzynka, Urszula Mrzygłód, and Aleksandra Pieloch-Babiarz equally contributed to this paper by writing the introduction, preparing the literature review, selecting the methodology, performing calculations, describing the results, and composing the conclusions.
Conflicts of interest
The authors declare no conflict of interest.
Citation (APA Style)
Matuszewska-Pierzynka, A., Mrzygłód, U., & Pieloch-Babiarz, A. (2023). ESG performance and dividend stability of the world’s largest enterprises. Journal of Entrepreneurship, Management, and Innovation, 19(4), 184-217. https://doi.org/10.7341/20231946