


Urban Pauli, Ph.D., Cracow University of Economics, ul. Rakowicka 27, 31-510 Kraków, Poland; This email address is being protected from spambots. You need JavaScript enabled to view it..p
Abstract
The main goal of the article is to present the research testing a model of investment structure in different phases of SMEs’ growth. The author assumed that the share and structure of investments vary in accordance with the stage of the company’s growth, and it is possible to describe the path which SMEs follow in their development. In the study based on organizations’ growth models, demand for particular resources in subsequent growth stages is presented. The model and investments structure is verified on a sample of 286 SMEs.
Keywords: small and medium enterprises, organizations growth, investments, resources, performance indicators.
Introduction
The process of a firm’s growth is never easy and it requires both knowledge and determination of the founder. Because of their potential and limited resources small and medium enterprises (SMEs) have to pay more attention to the use of their capabilities while planning activities that lead to achieving desired goals and success (Sheehan, 2013; Pauli, 2014). Since the early 70’s many theories describing organization growth have been developed. Most of them apply the analogy to the life cycle and compare the way organizations change with the stages between birth and death. The main aim of the studies focused on organizations’ growth is to provide entrepreneurs with information helping them to succeed in their ventures. However, according to McMahon (1998) most of the theories provide researchers and policy-makers only with information that makes it possible to choose between imperfect means for describing or characterizing SMEs growth.
There are many theories concerning the characteristics of subsequent stages of organizations’ growth (for example Jackson & Morgan, 1982; Churchil & Lewis, 1983; Mintzberg, 1984; Scott & Bruce, 1987; Hanks, Watson, Jansen & Chandler, 1993; Miller & Friessen, 2014) and they differ in accordance with the number of stages and their specification. Despite the fact that many authors conduct research in the field of organizations’ growth there is a limited number of publications that help entrepreneurs find the way they should act. Examples of such research are Greiner (1984), Adizes (2004), Quinn and Cameron (1984) and Flamholtz (1995). Greiner identified threats that can be both a constraint in the growth and an impulse for revolutionary changes in the way organizations act. Adizes described roles an entrepreneur should play in every growth stage. Quinn and Cameron as well as Flamholtz focused their research on sources of effectiveness. They described areas crucial for development. Although the studies show certain key factors or actions leading to success none of them presents how SMEs may prepare for potential threats or for using opportunities.
This paper presents the results of the research aimed at verifying theoretical model describing the structure of investments in resources that SMEs should implement in order to improve performance. To accomplish the main goal, the following partial aims were defined: (1) identification of the requirements for particular resources at subsequent stages of SMEs growth on the basis of literature study, (2) conducting empirical data analyses to find the structure of investments at defined stages, (3) verification of the relationship between investments structure and performance indicators.
In the first part of this article, the importance of particular resources in achieving success is presented on the basis of resource based view of the firm (RBV). It is followed by an analysis of organizations’ growth theories and summarized in the section presenting demands for resources in particular growth stages and describing potential investment areas.
In the second part of the article a theoretical model as well as hypotheses are presented. It is followed by the sample description and data analyses. Main findings and conclusions are included in the last part of the article.
Literature review
The role of intangible assets in innovation and firm growth
Companies, while running their businesses have to use resources enabling them to produce their goods or provide services. The structure of required resources can be dependent on the branch firms operate in, but even in the same branch the structure or the value of resources used may differ. Moreover, among companies that use very similar resources some may succeed while others fail. A foundation for explaining such a paradox is resource based view of the firm (RBV) developed by Barney (1991). According to this view the resources are “assets, capabilities, organizational processes, firm attributes, information and knowledge … that firms use to implement their strategies” (Barney, 1991, p. 101). These resources can be divided into three categories (1) physical capital, (2) human capital and (3) organisational capital. Physical capital consists of such elements as technology, plant, equipment, location, access to raw materials. Human capital are knowledge, skills, attitudes, and abilities employees have. Organisational capital consists of structural solutions, internal systems, communication, as well as relationships employees create in the workplace or with stakeholders outside the organisation. According to RBV companies may build their sustained competitive advantage by using these resources only when they are valuable, rare, inimitable and nonsubstitutable (VRIN) (Barney, 1991).
On the basis of RBV, Galbreath (2005) conducted research aimed at identifying which resources are most important for companies. In the theoretical framework of the study he defined resources as “firm-level factors that have the potential to contribute to economic benefits” (Galbreath, 2005, p. 980) that can be divided into three main categories (1) tangible resources, (2) intangible resources that are assets and (3) intangible resources that are capabilities. Tangible resources contain physical assets and financial assets, and their value is presented in the companies’ balance sheet. Intangible assets correspond to Barney’s organisational capital because they include (a) intellectual property assets, (b) organizational assets and (c) reputational assets. Intellectual property assets are patents, trademarks and copyrights as well as technology developed to fit the strategy. Organizational assets refer to culture, structure and internal systems as well as processes, which, because of the difficulties in duplicating them, may be characterised by VRIN attributes (Galbreath, 2005, p. 981). Reputational assets are originated in relationships the firm has with its suppliers, customers and business partners. Capabilities refer to what the firm ‘does’, and are defined as a capacity to make use of a company’s assets in order to reach a higher level of performance (Maritan, 2001, p. 514). Capabilities are skills and accumulated knowledge that are the foundation of organizational routines (Galbreath, 2005, p. 979). These routines, having a strategic aspect, let organisations achieve new resource configuration when changes on the markets occur. They can integrate, restructure and release resources providing high level of adaptability (Eisenhrdt & Martin, 2000, p. 1107). Capabilities stem from organizational practices and are crucial for achieving strategic goals, and they result from actions taken by people, organization’s history and stakeholders’ activity (Kostova & Roth, 1999). On the basis of such a categorization that divides resources into tangible assets and intangible resources (both assets and capabilities) Galbreath hypothesized that intellectual property assets, organizational assets as well as reputational assets contribute more significantly to the firm’s success than tangible assets. Moreover, organisational capabilities have the greatest impact on the firm’s success (Galbreath, 2005, pp. 981 – 982). Those hypotheses were supported in the research.
Similarly to Galbreath (2005), Pike, Roos and Marr (2005) on the basis of literature study concluded that factors building organizations’ potential may originate from: human capital, organisational capital, relational capital and physical as well monetary assets. Human capital includes knowledge, skills, motivation, abilities and attitudes of employees. They are crucial for fulfilling tasks on job positions, and because of their unique configuration cannot be imitated. Organizational capital consists of organizational culture, implemented strategies, structures, and intellectual property. Relational capital includes relations with customers, suppliers, subcontractors, business partners as well as with external experts. Physical assets consist of materials, equipment, land and buildings. The last category of resources (monetary) “are all financial assets that can be converted into cash” (Pike et al., 2005, p. 113). On the basis of conducted case studies Pike et al. (2005) proved the importance of intangible assets in the value creation process.
On the basis of RBV it can be concluded that SMEs’ success may stem from appropriate use of resources that are both tangible and intangible. Because it is impossible to have an access to all potentially required resources there is a need to identify which of them can be crucial at a given time. The demand for particular resources may refer to the stage of organizations’ growth.
Organizations’ growth theory
All theories concerning organizational growth tend to emphasize changes that appear in particular areas of firms’ functioning while shifting from one stage to another. One of the most frequently discussed models of SMEs’ growth that directly refers to SMEs is the one developed by Churchill and Lewis (1983). The authors created a model consisting of five main stages: existence, survival, success, take-off and resource maturity. The features by which each stage can be characterised are: the managerial style, organizational structure, extent of formality, major strategic goals and owner’s involvement in business. According to the model, SMEs change from small, owner-driven, informal and unstructured systems, into complex, and formalized organizations managed by professionals.
Scott and Bruce’s (1987) model consists of five stages that are: inception, survival, growth, expansion and maturity. The characteristics of organizations in each stage are very similar to those created by Churchill and Lewis, but Scott and Bruce added descriptions of possible crises that may appear between particular stages and are connected with changes which have to be made. These changes require particular resources which will be discussed in the following section.
Crises as a driving force for innovation and growth were also the foundation of Greiner’s model (1998). In this model five stages of evolutionary development were described that are: creativity, direction, delegation, coordination and collaboration. A switch between particular stages of evolutionary development is caused by crises connected with impossibility to manage the business in the same way. These crises can result in both accelerated development (described as a revolutionary growth) or as a constraint to further growth. As long as the organisation possesses resources required for rapid changes it can benefit from immediate changes, and achieve higher market level. The lack of required resources may cause that reaching the subsequent stage of evolutionary growth will be very difficult or even impossible.
In the model of Hanks et al. (1993) four main and two additional stages were described. Moreover, the authors listed main goals that should be reached in every stage to enable further growth. In the startup stage the main goal is to develop products or services. Organisations in the next stage, expansion, aim at enlarging markets for their products and services. Firms in the maturity stage should concentrate on internal processes and procedures. In the last stage, diversification, organisations search for new markets and launch new products or services. These four stages describe the path of incremental growth of organisations, if they succeed in preceding stages.
Miller and Friessen (2014) conducted research aimed at finding differences between main features of organizations in particular stages of growth. In the model they investigated a five stages approach. Their analyses of the model that consists of: birth, growth, maturity, revival and decline stages, aimed at finding and describing differences that appeared in four main dimensions that impact performance, such as: strategy, situation, structure and decision making style.
Quinn and Cameron (1983) created a model of organizational growth that focuses on effectiveness. They characterized four main stages of organizational development that are entrepreneurship, collectivity, formalization and control, and elaboration of structure. In each of these stages, organizational effectiveness stems from different configurations of four models: human relation, open systems, internal process and rational growth. Each of these models refers to a different type of resources and their configuration. That is why, companies should develop the resources that are crucial for reaching effectiveness in subsequent stages.
Key factors that affect performance were the foundation of Flamholtz (1995) model. On the basis of his study he identified six crucial components that are: identification of market segment or niche, (2) development of products and services, (3) acquiring resources, (4) development of operational systems, (5) development of management systems, and (6) developing corporate culture. A success or proficiency in these activities has a positive impact on the firm’s performance, which was proved in the later study of Flamholtz and Aksehirli (2000). Moreover, regardless of the growth stage, managers should focus on all of the “building blocks” interdependently, but according to the authors some of them might be more important than others in a particular stage of growth.
Investment areas
All of these models assume that changes in companies’ existence require changes both in internal systems and in the way they act on the market. While introducing such changes companies must use their resources in order to take advantage of emerging opportunities and prevent potential threats. On the basis of RBV (Barney, 1991) and the research conducted by Galbreath (2005) and Pike et al. (2005), resources are divided into five main categories: Human capital (HC), Organisational capital (OC), Relational Capital (RC), Tangible assets (TA), Financial assets (FA).
On the basis of organisation’s growth theories the requirements for resources in particular growth stages can be identified. They are summarized in Table 1.
| Stage | Resources requirements |
|---|---|
| Churchil and Lewis (1983) | |
| Existence | HC (owners abilities), FA, TA (plants), |
| Survival | HC (owners abilities), FA, TA (plants) |
| Success | OC (internal systems), HC (owners abilities, employees’ competencies) |
| Take-off | OC (internal systems, planning), HC (employees’ competencies), RC |
| Maturity | HC (employees’ competencies), RC, TA (if aiming at new markets) |
| Quinn and Cameron (1983) | |
| Entrepreneurial | RC, FA – most important are resources acquisition and external support |
| Collectivity | HC, RC – building external relationships, enhancing employees’ commitment and cooperation |
| Formalization and control | OC, FA, TA, RC – the main goal is to create stable environment for internal changes and development |
| Elaboration of structure | OC, HC, TA, RC – the main goal is to enhance performance, create optimized internal procedures and prevent organisation against external threats |
| Scott and Bruce (1987) | |
| Inception | FA, OC (formalization of basic processes), HC (ability to run and manage activities) |
| Survival | OC (to cope with high dynamics in sales, internal and external communication systems), RC (widening distribution channels) |
| Growth | HC (need to develop new products or enter new markets), TA (to cope with increasing sales level), |
| Expansion | RC (building distribution channels on new markets, analysing customers’ needs and responding to them), OC (information flow, management systems), HC (managing all processes and business areas) |
| Maturity | OC (managing systems), RC (searching for the opportunities to grow) |
| Hanks et al. (1993) | |
| Start-up | HC, FA, TA – main goal to develop products and services |
| Expansion | RC – main goal is to enlarge markets; OC – introducing organisational structure and managing systems |
| Maturity | OC – developing internal processes with accordance to the scale and scope of activities; HC – to manage and to fulfil specialized tasks |
| Diversification | HC – developing new products and services, RC – searching for new products, TA – launching new production lines |
| Greiner (1998) | |
| Creativity | TA (creating products and services), FA (searching for customers, producing), HC (owners competences) |
| Direction | OC (introducing managerial systems), HC (employing managers) |
| Delegation | OC (changes in structure, delegating power), HC (need to cope with a more complex activity), RC (extending markets and products range) |
| Coordination | OC (introducing performance management systems, reconfiguring structures), HC (a need for team work, focus on internal functions), RC (collecting data from the market, demand analyses) |
| Collaboration | HC (introducing new working standards, team work), RC (building new alliances, analysing customers’ needs) |
| Flamholtz and Aksehirli (2000) | |
| New venture | FA, TA, RC – critical development area are markets and products |
| Expansion | OC, HC, FA - critical development area are operational systems |
| Professionali-zation | OC, HC - critical development area are management products |
| Consolidation | OC, RC, HC - critical development area is corporate culture |
| Diversification/td> | FA, TA, HC, RC - critical development area are markets and products |
| Integration | FA, OC, HC - critical development area are – operational systems, management systems, organisational culture |
| Decline | FA, RC, HC – all critical development areas are crucial and there is a need to renew the firm. |
| Source: Churchill and Lewis (1983), Quinn and Cameron (1983), Scott and Bruce (1987), Hanks et al. (1993), Greiner (1998), Flamholtz and Aksehirli (2000). | |
In presented models of organizations’ growth requirements for particular resources are indicated. Because these resources can be used by SMEs in order to achieve desired goals, SMEs may invest in them. There is no unanimous structure of such resources. The importance of each of them in a particular stage of growth has not been indicated. The only conclusion that can be drawn is that financial as well as tangible assets are very important in the initial and late stages. It is caused by a necessity to create new or modify existing products which requires both finance and plants, machinery and other assets. In the middle phases intangible assets that consist of human capital, organizational capital and relational capital tend to be most important.
Research methods
Theoretical model and hypotheses
On the basis of organization growth models and RBV a general model of SMEs investments can be developed (see Figure 1).
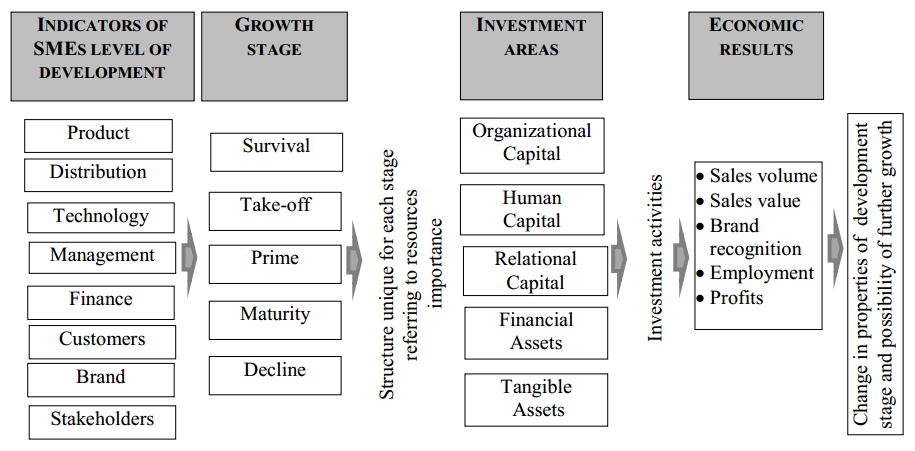
According to the model SMEs’ lifecycle can be divided into five main stages that can be characterised taking into account the following aspects (a) products and services, (b) distribution channels, (c) technology used and its origin, (d) management systems, (e) sources of financing and policies, (f) number of customers and relationships with them, (g) brand recognition and SMEs image, (h) types and number of other stakeholders. The specification of such components will indicate at which level of growth the organization is. The proposed stages are based on literature study and correspond mostly to the Churchill and Lewis as well as Scott and Bruce models. It should be mentioned that these two models do not include decline stage and, the first stage presented in both models (inception or existence) can be defined also as survival. Thus, in the theoretical model the following five stages were included:
- Survival – low market share, no regular customers, financed by owner’s capital, narrow offer,
- Take off – products meet expectations, increasing incomes, widening internal processes, brand recognition in some groups,
- Prime – increasing market share and incomes, developing and widening products, good brand recognition, new technological solutions, management systems,
- Maturity – high incomes, higher costs, well designed management systems, well recognized brand, well designed cooperation with stakeholders,
- Decline – decreasing incomes, market share and number of customers.
In each of these stages companies may invest in resources that are divided into five main categories (1) tangible assets, (2) financial assets, (3) organizational capital, (4) human capital, (5) relational capital. These investments should result in increasing the effectiveness of SMEs. Effectiveness can be evaluated by the means of performance indicators that are for example sales volume, sales value, brand recognition, profits, employment. Moreover, appropriate investments should result in achieving expected level of return on investments (ROI) that can be calculated by dividing total profits by total expenditures on investments.
On the basis of literature study and the developed model some implications for SMEs management can be drawn. Because in subsequent growth stages SMEs characteristics differ it can be stated that the share and value of investments in resources should be different and should correspond to requirements and identified gaps. It can be hypothesized that:
H1: the structure of investments in resources differ in particular stages of growth
Because investment decisions are not easy and their quality depends on the experience and knowledge of the founder as well as on environmental impact, it can be stated that even in a particular growth stage the structure of investments differs. The share of investments in particular areas may impact the ROI rate and performance indicators. Then it can be hypothesized that:
H2a: The structure of investments in a particular growth stage impacts the ROI level
H2b: The structure of investments in a particular growth stage impacts SMEs performance
According to RBV companies are more likely to achieve competitive advantage if they use resources that can be characterised by VRIN attributes. Of all the resources companies may use, those referring to relational, organizational or human capital are more likely to provide organisations with a possibility to achieve competitive advantage because they are difficult to imitate. Then it can be hypothesized that:
H3: SMEs that have a higher share of investments in intangible assets in total investments achieve higher performance
Such measures as: (1) service sales value, (2) products sales value, (3) service sales amount, (4) products sales amount, (5) profits, (6) number of customers, (7) number of employees, (8) general economic condition, (9) brand recognition can be used as key performance indicators (KPI).
Sample
The research was conducted in April-May 2014 and 2015 on a group of 470 SMEs operating in Poland. They were selected randomly from the database that consists of 1950 units. The study was conducted with the use of PAPI technique and the owners or managers were interviewed. After receiving all the questionnaires they were screened in order to find out if they were filled appropriately and if all the data required for analyses were provided. Unfortunately, not all respondents provided data concerning investment expenditures or profits, which caused that in further analyses only 286 SMEs were taken into account. General characteristics of the sample are presented in Table 2.
| Characteristic | Share in percent* |
|---|---|
| Profile | |
| Production | 29,37 |
| Services | 63,29 |
| Selling | 28,32 |
| Operating market | |
| Local | 40,56 |
| Regional | 30, |
| Country | 22,72 |
| International | 15,38 |
| Stage of growth | |
| Survival | 21,32 |
| Take-off | 13,63 |
| Prime | 18,18 |
| Maturity | 21,33 |
| Decline | 25,52 |
| Age | |
| 0-3 years | 4,20 |
| 3-5 years | 9,44 |
| 5-8 years | 15,73 |
| 9-12 year | 13,99 |
| 13-16 years | 12,94 |
| More than 16 years | 41,61 |
| * Shares of ‘profiles’ and ‘operating markets’ do not sum up to 100% because some firms declare that they have mixed profiles and operate on more than one market. Six firms did not provide information concerning age. | |
Analytical procedure
The first step in the analyses was to verify data and calculate ROI value on the basis of total investment expenditures and profits. Failing to provide certain data limited the database to 286 enterprises. The next step was to evaluate the growth stage. In the questionnaire, on the basis of literature study, some indicators of the level of growth were introduced. Respondents were asked to choose from a given range of answers the one that was the most appropriate to describe their enterprise. Indicators were connected with (a) products and services, (b) distribution channels, (c) technology used and its origin, (d) management systems, (e) sources of financing and policies, (f) number of customers and relationships with them, (g) brand recognition and SMEs image, (h) types and number of other stakeholders. For each indicator three to six questions were asked, giving a possibility to choose answers corresponding to the particular stage of growth. Provided options to choose from were based on (1) formality/complexity (for example in the ‘management system’ area the scope of answers to the question concerning job description was from ‘we do not have job description or tasks specifications’ to ‘we have detailed job descriptions, formalized functional relationships, and listed tasks executed while fulfilling roles’), (2) quantity (for example number of introduced innovations, range of products and services, number of distribution channels and facilities for customers), (3) relationships with stakeholders (for example share of occasional and regular customers, stability in cooperation with suppliers and subcontractors, involvement in CSR activities and cooperation with partners). On the basis of the answers the methods of grouping objects such as Ward analysis and a k-means clustering method were used to divide the companies into homogeneous groups in relati on to a given feature (Harti gan & Wong, 1979). These methods were used because the questi onnaire consisted of thirty two questi ons with four to eight opti ons to choose from. Having such a variety of possible combinati ons it was necessary to group companies taking into account similariti es in parti cular areas. K-means clustering enabled to group companies that are not identi cal but on the basis of means of given data they can be categorized as homogeneous. These results of grouping SMEs into fi ve stages of growth, and the share of the groups is presented in Table 2.
The next stage of analyses was aimed at verifying if there are diff erences between the structure of investments in parti cular growth stages between SMEs achieving high (1 and above) and low (below 1) level of ROI. In order to do it measures of structure and incidence were applied. The last stage was to verify if there is a correlati on between the share of parti cular areas of investments (HC, OC, RC, TA, FA) and ROI level as well as between parti cular performance indicators. The KPIs were measured by the means of perceived changes. In the research fi ve-grade scale was used in which parti cular values stood for: ‘1 – there was a huge decrease’, ‘2 there was a decrease’, ‘3 – remain stable’, ‘4 – there was increase’, ‘5 – there was a huge increase’.
Analysis
The structure of investments in investi gated companies diff ers in accordance with the stage of growth and ROI level. Moreover, changes in the structure of investments tend to be more visible in companies that achieve higher level of ROI (see Figure 2). Companies in this group seem to follow general requirements developed on the basis of literature study.
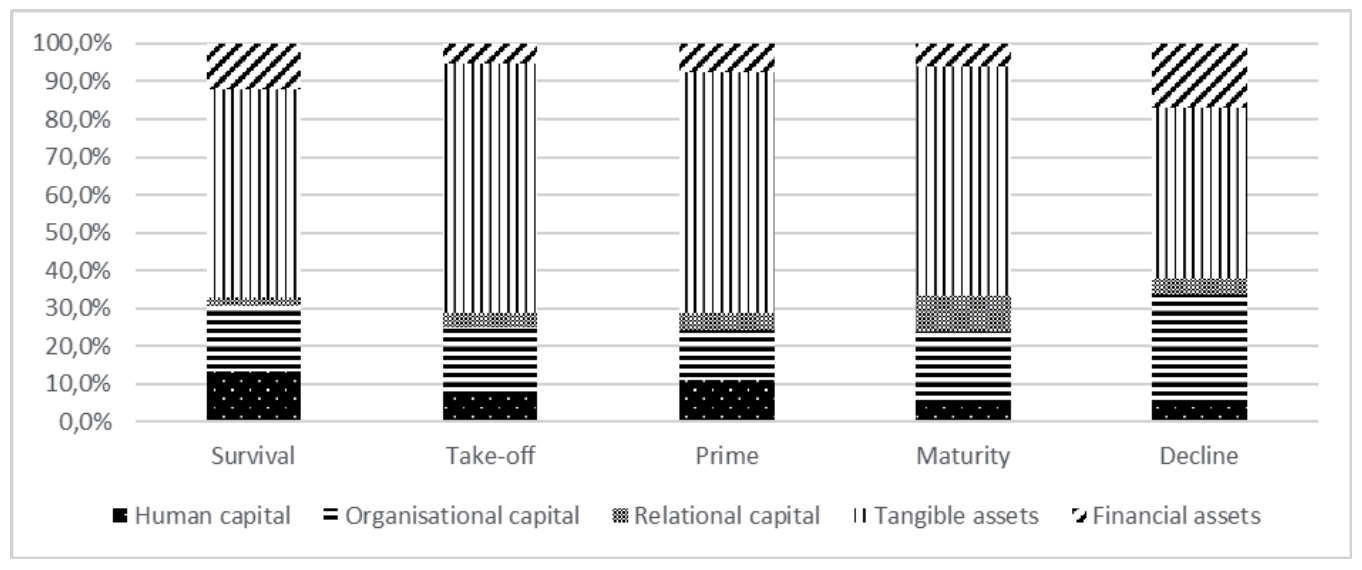
Taking into account TA that have the highest share in total investments (up to 66% - see Table 3) it can be seen that they take more than a half of total expenditures in the survival stage. When products and services meet market expectations, SMEs need to increase the value of investments in tangible assets in order to enhance production or service potential (the take-off stage). Having developed production or service systems, companies may profit from these investments and do not have to invest in TA at the same level. It results in a decrease in the share of investments in TA in total investments. The highest decrease can be observed between the maturity and decline stage in which companies, in general, lose their innovativeness. They are more focused on internal procedures and systems and pay less attention to investments in new products and services.
The share of investments in OC directly corresponds to the scheme presented by the authors of organization growth models. In the beginning this share is at the level of 20 percent because SMEs have to invest in know-how and create internal systems. Once developed procedures and operational schemes can suit organizations until their size makes it impossible to cope with all managerial duties for the entrepreneur. According to growth theories such a situation may appear it the prime stage which is characterized by a rapid growth. As a result of such a growth new internal systems have to be introduced, which results in an increase in the share of investments in OC. The increase in the share of OC can be observed until the decline stage because growing and more complex organizations require more advanced procedures and schemes.
Investments in HC are at the level of 13 percent in the survival stage, and this is the highest share among all the stages of growth. Such investments in the beginning are connected with hiring new employees and conducting trainings aimed at achieving appropriate level of skills and knowledge that are required for fulfilling tasks. The share of investments in HC decreases in the take-off stage because there is no need to hire new employees or to develop their competences. In the prime stage, as market share increases and rapid growth can be observed, companies hire employees to meet the growing demand for their products and services. It results in the increase in investments in HC. In the subsequent stages as the market dynamics are not so high, and the company is less innovative, managers believe that there are no requirements for investing in HC.
Investments in RC are very low in all the stages of SMEs growth. In the beginning, as the company is very young and not recognized on the market, there are no areas in which it may invest in order to build relationships with stakeholders. In subsequent stages the share of investments in RC increases because SMEs pay more attention to their relations with customers, suppliers and business partners. The highest share of investments in RC is in the maturity stage, when companies become well-recognized market players and are involved in many incenti ves oriented on customers as well as on business partners. Companies in this stage also become a member of associati ons or invest in CSR acti viti es. In the maturity stage, because some fi nancial problems may appear, investments in RC might be the fi rst to cut off .
The share of investments in FA in the survival stage is at the level of 12 percent which can refer to the situati on in which the owner tries to secure his/ her cash-fl ow by investi ng in assets with high liquidity. In subsequent stages the share of investment in FA is very low which is the result of investi ng in other resources that can provide further growth. The share of investments in FA increases in the decline stage. It is connected mostly with a possibility to invest in the shares of other companies. Owners may also allocate short-term fi nancial surplus, that results from gaining profi ts and unwillingness to invest in innovati ons, in fi nancial assets with high liquidity.

The structure of investments in companies with a low level of ROI is diff erent than in organisati ons with high level (see Figure 3). Although, similarly to companies with high level of ROI, TA and OC are the resources in which companies invest the most, there are no such dynamics in changes in the share. Starti ng from the take-off stage the share of investments in HC, RC, FA and OC in total investments seems to be at almost the same level as in all subsequent stages. Only in the case of TA an increase in the share of investments can be observed. It can result from investi ng in new machinery, equipment or buildings that are required for running the business. The highest increase in the share of investments in the TA is in the maturity stage, when companies have a good and stable market positi on. It seems that the owners follow the same investments schemes for all subsequent stages and their growth does not result from planned activities but is rather the consequence of changes on the market to which they try to adapt. Such an approach causes that most investment decisions, can be inadequate or not as required as others, which results in lowering ROI and financial conditions of SME.
| ROI Level | Survival | Take-Off | Prime | Maturity | Decline | |
|---|---|---|---|---|---|---|
| Human capital | High Low |
13,4% 12,6% |
7,2% 15,1% |
11,2% 12,1% |
5,0% 8,6% |
4,7% 13,4% |
| Organisational capital | High Low |
17,4% 30,4% |
17,9% 19,1% |
13,0% 21,3% |
18,7% 20,1% |
29,1% 23,1% |
| Relational capita | High Low |
2,3% 4,1% |
3,8% 9,6% |
4,4% 6,7% |
9,5% 5,8% |
4,1% 4,3% |
| Tangible assets | High Low |
54,9% 48,7% |
65,9% 50,6% |
63,9% 52,6% |
60,9% 61,3% |
45,1% 55,9% |
| Financial assets | High Low |
12,0% 4,2% |
5,3% 5,9% |
7,4% 7,2% |
6,0% 4,2% |
17,0% 3,2% |
Analysing the correlation between investments in particular areas and performance indicators it can be observed that such a correlation appears mostly in the decline stage (see Table 4). What is more, it seems that not every resource has an impact on performance, so the structure of investments should differ.
In the survival stage there is a positive correlation between investments in TA and ROI level. The higher the share of TA investments the higher level of ROI is achieved. Investments in OC are negatively correlated with employment, which means that the more SMEs invest in OC the less likely they are to hire new employees. Changes in working conditions as well as introducing new procedures can positively impact efficiency, which helps companies achieve desired level of performance without hiring new workers. FA investments are negatively correlated with profits and financial condition. According to literature study SMEs in initial stages are financed mostly by the owners’ capital and in order to survive they have to invest in other resources to build their competitive potential. That is why, the share of investments in FA negatively impacts these performance indicators.
| Mean | S.D. | Share of investments in particular areas | Share of all intangibles | |||||
|---|---|---|---|---|---|---|---|---|
| HC | OC | RC | TA | FA | ||||
| Survival stage | ||||||||
| ROI | 0,5470 | 0,9028 | -0,0936 | -0,2768 | -0,0330 | 0,3104* | 0,0462 | -0,3224* |
| Take-off stage | ||||||||
| Services sale (quantity) | 3,0000 | 0,7845 | -0,4354* | 0,0759 | -0,5750* | 0,4367* | 0,0000 | -0,4504* |
| Services sale (value) | 2,9259 | 0,8286 | -0,3060 | 0,1591 | -0,5406* | 0,2976 | 0,0309 | -0,3249 |
| Number of customers | 3,0741 | 0,9578 | -0,0769 | 0,3943* | 0,1486 | -0,2288 | -0,1449 | 0,3200 |
| Decline stage | ||||||||
| ROI | 1,2759 | 2,0797 | -0,2063 | 0,2395 | -0,1338 | -0,2961* | 0,3282* | 0,1172 |
| Products sale (quantity) | 3,4444 | 0,8165 | -0,0001 | 0,3004* | 0,2257 | -0,2915* | -0,0363 | 0,3034* |
| Services sale (quantity) | 3,4444 | 0,7931 | 0,0799 | 0,3491* | 0,1748 | -0,3599* | -0,0373 | 0,3707* |
| Products sale (value) | 3,4630 | 0,7942 | 0,0017 | 0,3449* | 0,0981 | -0,3092* | -0,0459 | 0,3258* |
| Services sale (value) | 3,4630 | 0,7942 | 0,0639 | 0,4733* | 0,0366 | -0,4290* | -0,0724 | 0,4566* |
| Profits | 3,3889 | 0,7115 | -0,0096 | 0,3684* | -0,0415 | -0,2715* | -0,1098 | 0,3225* |
| Number of customers | 3,4444 | 0,7439 | 0,0435 | 0,4319* | 0,2077 | -0,3797* | -0,1254 | 0,4362* |
| Employment | 3,2963 | 0,7172 | 0,1647 | 0,2099 | 0,1785 | -0,1610 | -0,2318 | 0,2784* |
| Financial condition | 3,3333 | 0,6443 | -0,0802 | 0,4200* | -0,1026 | -0,2870* | -0,1012 | 0,3330* |
| Brand recognition | 3,4444 | 0,6344 | -0,0529 | 0,3305* | -0,1508 | -0,1768 | -0,1590 | 0,2558 |
| *correlation with the p<0,05 | ||||||||
In the take-off stage the share of investments in TA is positively correlated with the quantity of service sale. Investing in such resources makes it possible for organisations to provide their services to a wider range of customers and create potential for further growth. However, it seems that the market share is not so high that SMEs should invest in HC (for example in trainings or hiring new employees) because investments in this area are negatively correlated with the service sale quantity. A positive correlation can be observed between the share of investments in OC and the number of customers. In this stage investments in OC refer to launching new distribution channels which can widen the number of potential clients. Investing in RC is negatively correlated with the service sale quantity and value. Companies in this stage have no brand recognition and are not treated as valuable business partners because of their overall performance. This may result in a situation in which investments in relations with customers, suppliers or business partners may not impact performance.
In the prime and maturity stage no correlation was found between the share of investments in particular resources and performance indicators.
In the decline stage the correlation between OC as well as TA and almost all KPIs is statistically proved. It should be mentioned that the share of investments in OC is positively correlated with eight out of nine KPIs while TA share is negatively correlated with seven out of nine KPIs. In the decline stage SMEs are well developed but in general they lose their market position. According to literature study, the most important challenge is to optimize internal processes because a number and scope of implemented procedures can cause a red tape crisis as well as an increase in general costs. That is why, investing in OC, aimed at downsizing and implementing more flexible systems, can result in the increase of KPIs. A negative correlation between KPIs and the share of investments in the TA can stem from the necessity to develop new products and services, or entering new markets, rather than from investing in assets that are required for maintaining current production or service schemes. Moreover, after the maturity stage many firms tend to invest in TA to build an image of a successful organization. This may result in making investment decisions that have no or little impact on performance.
There is no correlation between the share of investments in intangible assets (IA) and performance when taking into account the whole sample of investigated SMEs. On the basis of conducted analyses it can be proved that only in the case of companies in their decline phase, investments in IA are correlated with almost all performance indicators (except brand recognition). In the decline stage as well as maturity stage, SMEs are well developed and have a potential to produce goods or provide services. There is no need to invest in TA because companies in these stages achieve the desired level of productivity. That is why, investments in IA may mostly impact performance in these stages.
Discussion
On the basis of conducted analyses it can be stated that there is a difference between the share of investments in particular resources between SMEs that achieve high or low ROI level. The most important difference is in the dynamics of changes in particular investment areas in subsequent growth stages. Owners and managers that achieve high ROI level can be perceived as the ones who analyse the situation of their enterprises and act proactively or responsively in order to solve emerging challenges. The structure of investments corresponds to the theoretical model of the study. On the basis of organisational growth theories implications referring to the demand of particular resources in subsequent stages were developed. SMEs with high ROI tend to follow these directions. They spend most of their investments on TA but the share of such investments decrease after the take-off stage when companies have achieved the level of infrastructure that enabled them to produce or provide services. According to Barney (1991) such resources cannot build competitive advantage because they have no VRIN attributes. That is the reason why owners or managers may switch their investments’ capital into other resources. Investing in OC, RC or HC may cause that they will be able to compete on markets and achieve desired goals. At the same time SMEs with low level of ROI can be perceived as the ones that follow the same investments scheme in all the stages. Although the share of particular investments area can change slightly major differences do not appear. It may stem from the owners’/managers’ approach, according to which once made investing decision, that enabled SMEs survival, should be (or can be) appropriate in subsequent stages. Such an approach does not correspond with the demand for resources that emerge while SMEs are growing and can be caused by both internal as well as external changes (connected with the branch, competitors or customers’ expectations). It can be concluded, that the first hypothesis that the structure of investments in resources differ in particular stages of growth is supported.
cular stages of growth is supported. On the basis of conducted analyses it should be concluded that hypothesis 2a is not supported. The structure of investments in a particular growth stage does not impact the ROI level. There is no correlation between the share of investments in particular resources and ROI level. Although on the basis of theoretical study the demand for specific resources can be identified and the share of investments in them may differ in accordance with the branch or SMEs profile.
According to the data, hypothesis 2b is partly supported. The structure of investments in a particular growth stage impacts SMEs performance but it can be statistically proved only in the decline stage and for two resources – TA and OC. In the survival and take-off stage the share of investments impact only a few KPIs and in the prime and maturity stage the correlation was not found. It can be then concluded that performance of a particular SME is mostly dependent on individual features connected with profile, type of goods or services, branch or market on which they operate. Only in the last stage of growth, when SMEs become more powerful and achieve desired market position some general scheme can be found.
Similarly, the third hypothesis is supported only for companies in the decline stage. Higher share of investments in intangible assets in total investments impacts SMEs performance. While achieving desired market position companies are more likely to build their competitive advantage on the basis of intangible assets, that can be characterised by VRIN attributes. In early stages of growth SMEs have to use other resources (mostly tangible ones) to survive and achieve market share and to build a potential for further growth.
Conclusion
The main goal of the article was to verify if there is a structure of investments in resources that provides SMEs with the desired ROI level and potential for further growth. Statistical analyses based on a sample of 286 Polish SMEs show that there is a significant difference between the share of investments among companies that were investigated. Those that achieve high level of ROI tend to differentiate the share of investments in particular resources in subsequent stages. SMEs with low level of ROI maintain similar structure of investments in each stage. Lack of analyses of demands for resources can result in lowering not only the ROI level but also the performance of SMEs and their potential for further growth. Such analyses were conducted among SMEs that operate in Poland but conclusions seem to be relevant for other countries as well. Such an assumption stems from the similarity of the Polish market and other (especially) European markets, and what is more, business profiles of investigated SMEs are also present in other countries.
Despite the fact that the structure of investments differs no correlation between the share of investments in particular resources and KPIs was found in survival, take-off, prime and maturity stage. Such a correlation was statistically supported in the decline stage. It was found that in this stage OC as well as overall investments in tangible assets impact almost all KPIs. Moreover, the share of investments in TA is negatively correlated with these indicators.
On the basis of conducted literature study as well as statistical analyses it can be concluded that organisations’ growth theories give clear directions to owners/manager in what they should invest in a particular stage of growth. Following such directions enables reaching desired market position, adequate performance and creates the potential for further growth.
Despite the fact that such conclusions were made this study has several limitations. First of all it should be mentioned that all the information was gathered during interviews with managers or owners of SMEs and referred only to the data included in financial statements for 2013 or 2014. Analysing the impact of investments on performance and growth makes it necessary to compare the collected data with those referring to a longer period of time. Moreover, taking into account the total number of existing SMEs the sample of 286 companies is relatively small. What is more, these companies represent different branches and sizes (although by definition all belong to the group of small or medium enterprises). This may cause some biases because in some branches connected with production the impact of particular resources on performance and growth can be totally different than in companies that offer services. On the basis of conducted statistical analyses it can be stated that further studies should aim at building econometric model describing the most appropriate structure of investments at particular stages. However, because of the diversity and number of branches SMEs operate in, it might be necessary to narrow the sample only to chosen ones or to increase the number of SMEs investigated.
References
- Adizes, I. (2004). Managing corporate lifecycles. Carpinieria: Adizes Institute Publications.
- Barney, J. B. (1991). Firm resources and sustained competitive advantage. Journal of Management, 17(1), 99-120.
- Churchil, N. C. & Lewis, V. L. (1983). The five stages of small business growth. Harvard Business Review, 61(3), 30-50.
- Eisenhardt, K. M. & Martin, J. A. (2000). Dynamic capabilities: what are they? Strategic Management Journal, 21(10-11), 1105-1121.
- Flamholtz, E. (1995). Managing organizational transitions: implications for corporate and human resource management. European Management Journal, 13(1), 39-51.
- Flamholtz, E.G. & Aksehirli, Z. (2000). Organizational success and failure: an empirical test of a holistic model. European Management Journal, 18(5), 488-49.
- Galbreath, J. (2005). Which resources matter the most to firm success? An exploratory study of resource-based theory. Technovation, 25(9), 979- 987
- Greiner, L. E. (1998). Evolution and revolution as organizations growth. Harvard Business Review, 76(3), 55-68.
- Jackson, J. H. & Morgan, C. P. (1982). Organization theory. A macro perspective for management. London: Prentice Hall.
- Hanks, S., Watson, C., Jansen, E. & G. Chandler, G. (1993). Tightening the life-cycle construct: a taxonomic study of growth stage configurations in high-technology organisations. Entrepreneurship Theory and Practice, 18(2), 5-29
- Hartigan, J.A., Wong & M.A. (1979). A k-means clustering algorithm. Journal of the Royal Statistical Society. Applied Statistics, 28(1), 100-108.
- Kostova, T. & Roth, K. (1999). Transnational transfer of strategic organizational practices: a contextual perspective. Academy of Management Journal, 24(2), 308-324.
- Maritan, C. A. (2001). Capital Investments as investing in organizational capabilities: an empirically grounded process model. The Academy of Management Journal, 44(3), 513-531.
- McMahon, R.G.P. (1998). Stage models of SME growth reconsidered,The Flinders University of South Australia Research Paper Series, 98-5. Retrieved from http://www.flinders.edu.au/sabs/business/research/papers/98-5.doc
- Miller, D. & Friessen, P. H. (2014). A longitudinal study of the corporate lifecycles. Management Science, 30(10), 1161-1183.
- Mintzberg, H. (1984). Power and organization life cycles. Academy of Management Review, 9(2), 207-224.
- Pauli, U. (2014)) Rola szkoleń pracowników w rozwoju małych i średnich przedsiębiorstw (The role of training in small and medium enterprises’ growth). Cracow: University of Economics Press.
- Pike, S., Roos, G. & Marr, B. (2005). Strategic management of intangible assets and value drivers in R&D organisations. R&D Management, 35(2), 111-124.
- Quinn, R. E., Cameron, K. (1983). Organizational life cycles and shifting criteria of effectiveness: some preliminary evidence. Management Science, 29(1), 33-51.
- Scott, M. & Bruce, R. (1987). Five stages of growth in small business. Long Range Planning, 20(3), 45-52.
- Sheehan, M. (2013). Human resource management and performance: evidence from small and medium sized firms. International Small Business Journal, 32(5), 545-570.
Acknowledgements
The research was financed by the funds of Polish National Science Center. Grant no: DEC-2012/07/d/HS4/00789.
Biographical note
Urban Pauli, Ph.D., works in the Department of Human Capital Management at the Cracow University of Economics. Scientific interests focus on human resources management as well as on management of small and medium enterprises. He is the author of the book “The role of trainings in small and medium enterprises growth”, and many other publications.